Kaggriculture Working Note (Part 1): A Farming Economy and the Replay Meta

Kaggriculture Working Note (Part 1): A Farming Economy and the Replay Meta
A working note from the first week of serious play. This is not a recipe for a finished winning bot. It is a field report: how the game’s economy actually works, how I built a hand-crafted economic policy for it, why the top of the leaderboard is currently dominated by verbatim replays of other people’s games, and what happened when I started reverse-engineering those replays instead of fighting them.
Competition: Kaggriculture
My agent notebook: Kaggriculture: Structured Economic Policy
If you have never seen the game before, the best visual introduction is Georgy Mamarin’s Kaggriculture, Visualized: What Every Crop Pays — it draws every mechanic instead of explaining it in prose. I will only summarize what this note needs.
Part I. A tiny farm economy
1. The game in one paragraph (and one honest page)
Kaggriculture is a two-player farming simulation. Each player runs their own $10\times10$ farm for one season — 30 days of 24 turns each, so
\[T = 720, \qquad d_t = \left\lfloor \tfrac{t}{24} \right\rfloor, \qquad h_t = t - 24\,d_t .\]Every turn, each of your field units — one farmer plus up to a dozen hired hands — takes exactly one action: move a cell, plant, water, harvest, fertilize, feed, care, build a coop or pasture, dig out a weed, or pick up / drop inventory at the shed. On top of that you may queue up to ten market orders per turn: buy seeds and animals at fixed prices, sell produce at a floating price, buy back wheat or fertilizer, hire another hand, or unlock another $5\times5$ quadrant of land for $1k / $2k / $4k. After 720 turns, whoever has more money in the bank wins. Unsold inventory counts for nothing.
The daily rhythm matters more than any single action. Workers spawn at the shed each morning and auto-drop whatever they carry back into it at day’s end — and the shed holds only 100 non-seed items, with any overflow silently discarded. Plants must be watered and animals fed every day; miss two consecutive days and the plant becomes a weed, the animal walks off the map, unrecoverable. The whole game is a scheduling knife-edge dressed up as a farm.
Here is my agent playing a full season against the built-in starter bot, one frame per day:
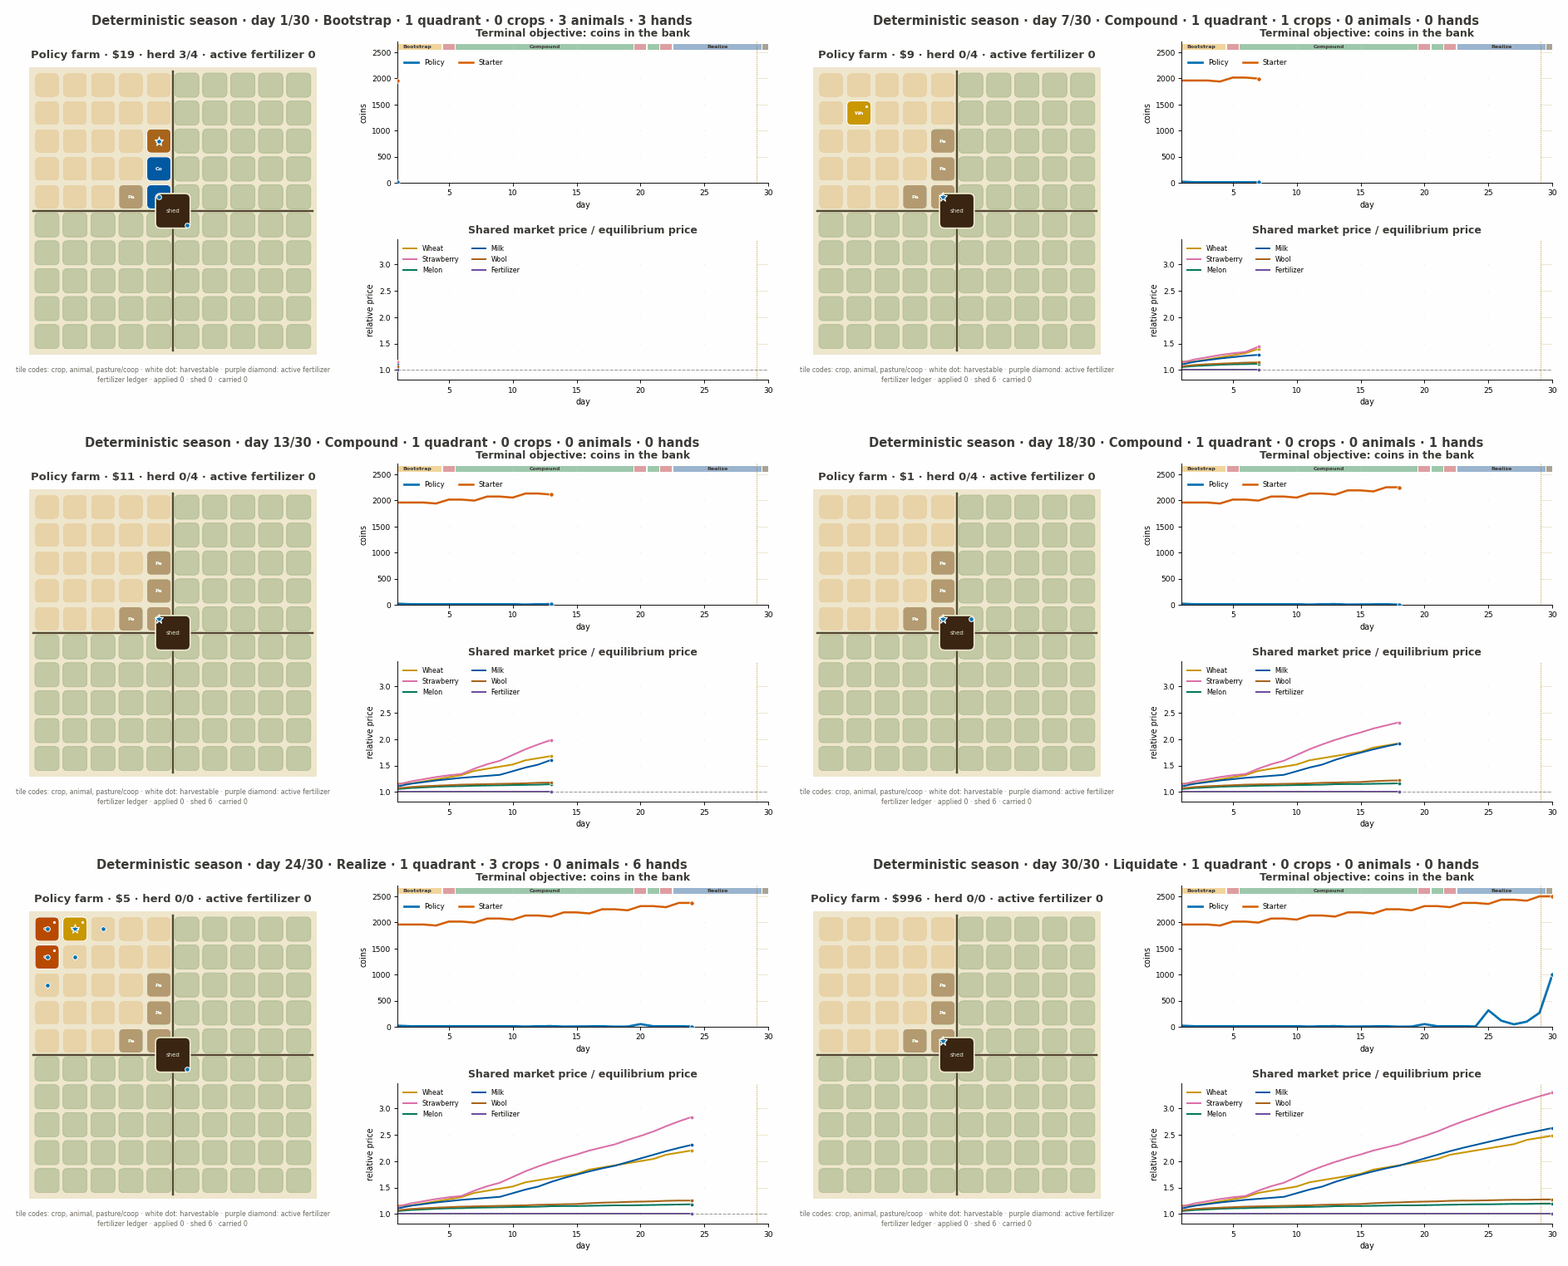
The farm fills, the herd assembles, the bank curves diverge. Thirty days in forty-five seconds.
2. What every crop pays
The production side is a small table of assets with very different shapes. One-time crops (wheat, carrot, melon) grow, get harvested once, and vanish. Ongoing producers (tomato, strawberry, animals) yield on a schedule for as long as you keep servicing them.
| Asset | Cost | Base price | First yield | Cadence | Rough value per tile-day |
|---|---|---|---|---|---|
| Wheat | 10 | 25 | day 2 | once | modest but fast |
| Carrot | 20 | 35 | day 2 | once | modest |
| Tomato | 50 | 60 | day 8 | daily | high |
| Strawberry | 100 | 120 | day 10 | every 2 days | high |
| Melon | 80 | 250 | day 10 | once | spiky |
| Goose / egg | 300 (+coop) | 50 | day 4 | daily | steady |
| Cow / milk | 400 (+pasture) | 160 | day 8 | every 2 days | high |
| Sheep / wool | 500 (+pasture) | 200 | day 6 | every 3 days | spiky |
Care compounds. For one-time crops, watering during the second half of the growth window adds one extra unit per day — two if fertilized — so a well-serviced melon tile is not a 1-unit tile but a 6-unit, $1,000-gross tile. Animals bank a +2 yield bonus for every day they are both fed and cared for, paid out at the next production tick. Skimping on service doesn’t just risk losses; it quietly halves your yield curve.
And animals eat wheat daily, which couples the livestock economy to the crop economy: a fourteen-animal herd burns a wheat-tile’s worth of output every single day, all season. You either grow that feed, or you buy it on a market whose price is drifting upward the whole time. Keep this coupling in mind — it becomes the main character of Part IV.
3. The market is the game
Prices are not fixed. Every product has a shared market inventory that starts at $I_0 = 10{,}000$ units, and the sell price is a monotone curve around that equilibrium:
\[p_r(I)=\max\!\Bigl(1,\ \operatorname{round}\widetilde p_r(I)\Bigr), \qquad \widetilde p_r(I)= \begin{cases} b_r+\alpha_r^{-}\,f_r^{-}(I_0-I), & I<I_0 \quad (\text{scarcity} \Rightarrow \text{price up}),\\[2pt] b_r-\alpha_r^{+}\,f_r^{+}(I-I_0), & I\ge I_0 \quad (\text{glut} \Rightarrow \text{price down}). \end{cases}\]The shape functions $f\in{\text{linear},\ \text{sq},\ \sqrt{\ },\ \log}$ differ per product and per side of the curve, and this asymmetry is where the strategy lives:
| Product | Base | Glut side $f^{+}$ | Glut sensitivity |
|---|---|---|---|
| Wheat | 25 | log | almost immune — absorbs oversupply |
| Egg | 50 | log | almost immune |
| Tomato | 60 | sqrt | moderate |
| Strawberry | 120 | linear (steep) | crashes |
| Milk | 160 | linear (steep) | crashes |
| Wool | 200 | sq | crashes hard |
| Melon | 250 | sq | crashes hardest |
A staple like wheat barely notices a glut. A premium product goes off a cliff: in the frontier game I dissect in Part IV, a 42-unit melon dump walks the price from $276 down to $232 inside nine turns, and the two players’ combined milk sales — 459 units into a thin, steep curve — realize barely half of base price. In one of my own instrumented games the wool price spent nineteen consecutive turns pinned at $1, because combined sales ran roughly five times deeper than the order book.
Three more mechanics complete the market picture:
- Buy-backs are asymmetric. Only wheat and fertilizer can be bought back from the market; everything else sells one way. Feed logistics therefore have a market price, and it moves.
- Quoting is fair. Buys are quoted at post-trade inventory and sells at pre-trade inventory, so an immediate buy-then-sell round trip nets exactly zero. There is no free arbitrage loop — which becomes an important plot point later.
- The town props everything up. An NPC town consumes a little of every product on a schedule — and its appetite roughly doubles by day 10 and quadruples by day 20 as shops unlock. Wheat drifts from $25 into the mid-$50s over a season largely on town demand alone. Every seller in the game is, in effect, front-running the town’s growing hunger.
4. Two farms, one market
Here is the structural fact that explains most of this note: you cannot touch the opponent’s farm. No raids, no blocking, no interaction of any kind on the field. The only coupling between the two players is the shared market curve and the shared town demand. Your sale today is your opponent’s price tomorrow — and that is the entire extent of the player-versus-player game.
It looks like this in practice. Below is a real ladder episode between two ~2,650-rated players, captured at day 22 — the game I will take apart move by move in Part IV:
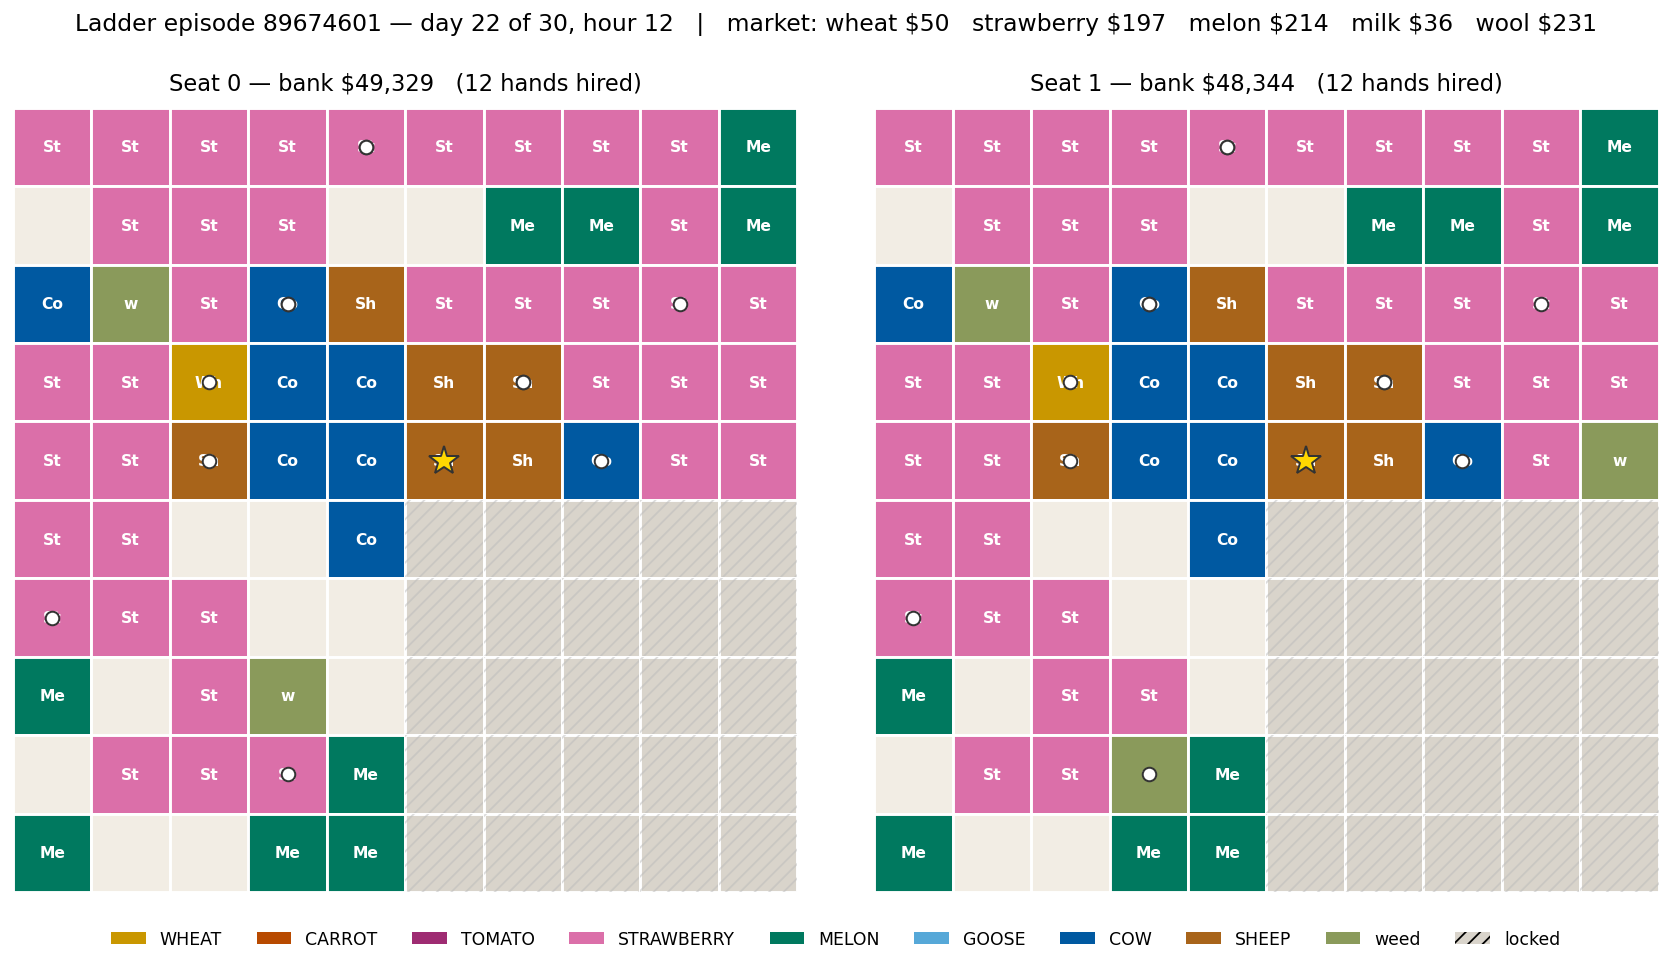
Two farms, nearly mirror images — strawberry walls, identical pasture cores, banks within a thousand dollars of each other after 22 days. Hold that thought; the reason they are mirror images is the subject of Part III.
So Kaggriculture is roughly 95% a solitaire optimization problem — run the best production program you can — and 5% a market game: when you sell into a shared price curve that your opponent is also selling into. That 5% turns out to decide games between equals, but the 95% decides everything else. Both halves matter in what follows.
Part II. A structured economic policy
5. One objective, three invariants, four phases
My agent is a single hand-crafted policy, no learned components yet. Everything is denominated in terminal money. Assets only matter through the cash-conversion chain
\[B_0 \longrightarrow K_t \longrightarrow Y_t \longrightarrow Z_t \longrightarrow B_T,\]capital committed, physical output, liquidatable stock, terminal bank — and the objective is simply $\max_\pi\ \mathbb E_\pi!\left[B_T^{(p)}-B_T^{(1-p)}\right]$. Three invariants keep the policy honest:
- irreversible losses precede optional growth — watering a plant that would become a weed outranks planting a new one;
- field commitments precede market commitments — same-turn sale proceeds can never fund a field action that already resolved;
- every commitment must be terminally feasible — a crop with growth time $g_c$ is only planted if maturity, harvest, the walk back to the shed, and the sale all fit before the bell:
On top of the invariants sits a coarse phase machine: a bootstrap phase through day 4 (build the engine), a long compounding phase through day 21 (grow everything that clears its shadow prices), a realization phase (stop planting what can’t mature, start converting), and a terminal liquidation window over the last 22 turns, where the only jobs that exist are harvest, carry, drop, and sell. A crisis override preempts all of it whenever assets-at-risk exceed what the workforce can service that day.
6. From observation to action
Each turn the observation flows through a fixed pipeline: survey the farm, assign spatial roles to tiles, turn urgency and value into discrete jobs, then match workers to jobs:
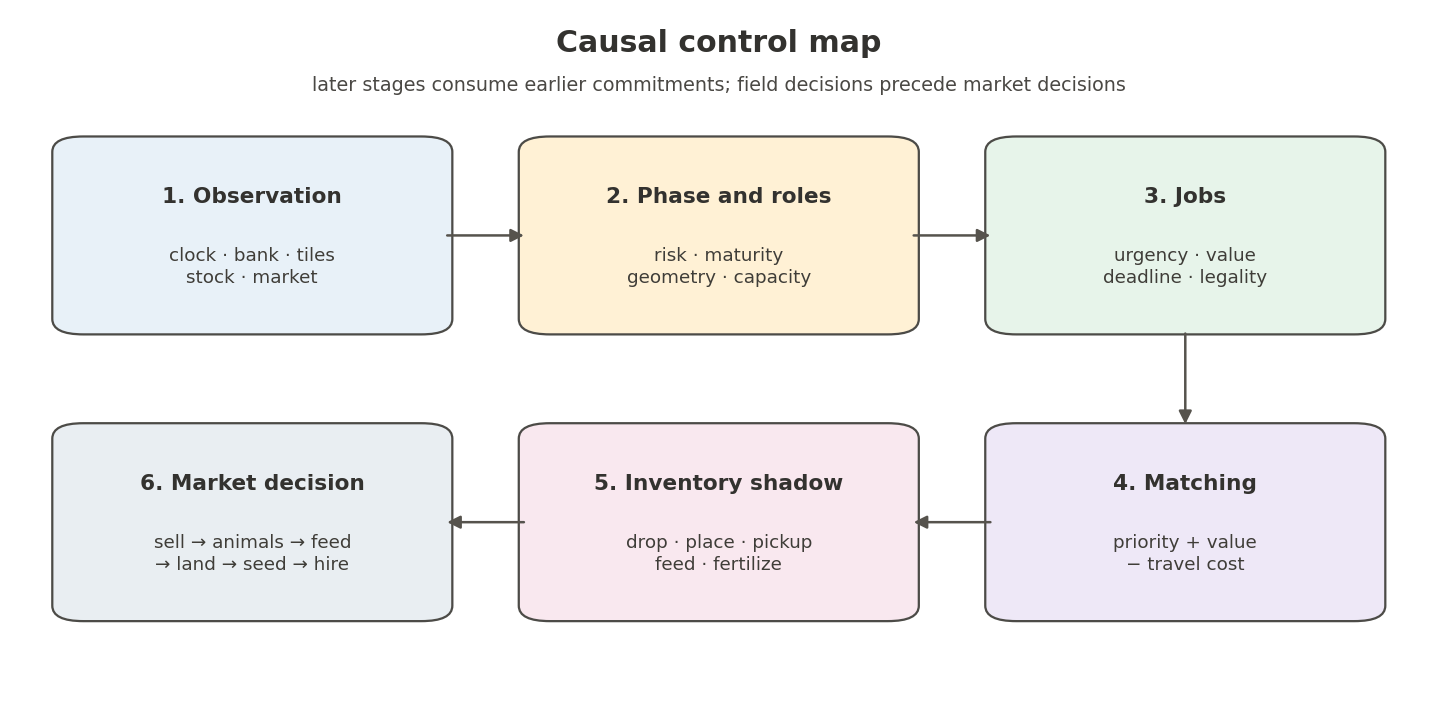
Jobs carry a discrete priority and a dollar value: a plant one missed watering from death outranks feed, which outranks care, which outranks routine watering, which outranks planting something new. The matcher scores every worker–job pair with
\[S_{ij}=b_{p_j}+v_j-8\,d_1(x_i,x_j),\]a priority bonus plus economic value minus a travel cost, with strictly ordered priority bonuses
\[(b_{-1},b_0,b_1,b_2,b_3,b_4,b_5)=(120000,\ 100000,\ 1500,\ 750,\ 250,\ 0,\ -100)\]so that “an animal will escape tonight” can never lose to “this melon is worth harvesting” no matter what the dollar columns say. Assignments consume an inventory shadow as they are made — a worker assigned to feed reserves the wheat it will use, a plant mission reserves its seed — so two workers can never spend the same item, and each unit and each mission is matched at most once per turn.
Labor itself is priced by the game, and the pricing is beautifully hostile: the $n$-th hire of a day costs a Fibonacci wage, so a twelve-hand day costs $C(12)=\sum_{n<12}F_n=376$ while the thirteenth hand alone costs $F_{12}=233$ — more than half the entire twelve-hand payroll, for one extra pair of hands. The policy sizes its workforce against the job ledger:
\[H_t^{*}=\min\!\Bigl(\overline H(d_t),\ \max\bigl[H^{\mathrm{floor}},\ \lceil (J_t+2R_t)/7\rceil\bigr]\Bigr),\]jobs due plus a double weight on assets one missed service away from loss, seven services per hand per day, capped by a maturity-dependent ceiling. Whether that thirteenth Fibonacci hand ever pays for itself is a question Part IV answers with a ledger.
7. A day in the life
The same machinery, zoomed into a single day — every hourly routing decision on day 21, when the farm is at full sprawl:
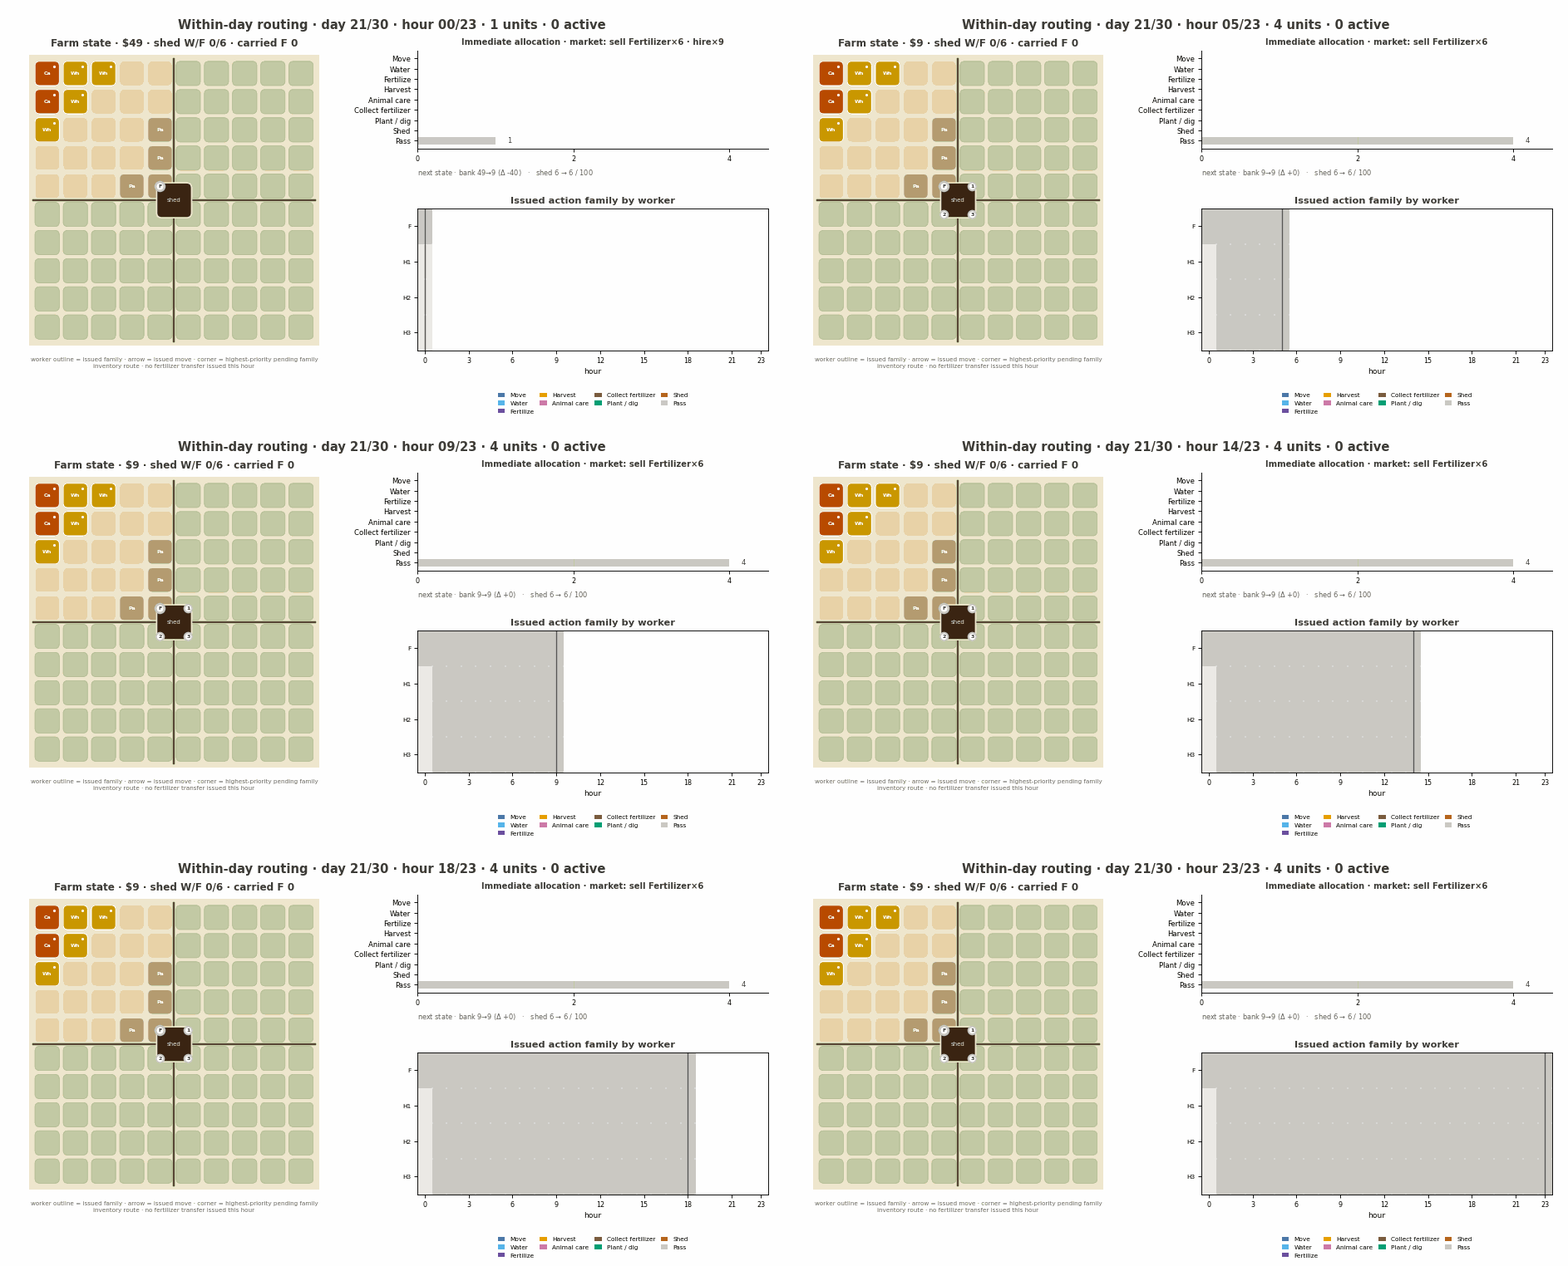
Watching this loop taught me more than any aggregate metric. You can see the morning fan-out from the shed, watering routes threading the strawberry wall, harvest convergence, the inventory shuttle — and you can also see workers standing still. I later measured that idle share precisely: my units burn 17.9% of their turns doing nothing, and that number turns out to be the single most expensive line in the whole system. Part IV puts a dollar figure on it.
8. Where that lands on the ladder
Honest accounting, with the measurement caveats stated. This policy converges to a public score in the high-1200s. Against opponents joined to the live leaderboard at their current scores, its measured performance rating is mid-1500s to low-1600s — comfortably above its displayed score, because fresh submissions start cold and the matchmaker feeds you what it feeds you. Two facts from that measurement worth keeping:
- of my last ~130 rated games, 95% were scheduled against opponents ranked below the top 50 — and against that field the policy beats the anchor-implied expectation by a wide margin;
- against the actual top 50 I have six games of evidence, one win, and a median terminal margin around −20,000. The wall is real, it is measured, and it is exactly where this note is headed.
The top of this ladder, at the time of writing, is above 2,900 — and that is where this stops being a design diary and becomes a detective story.
Part III. The replay meta, or: why copying is beating everyone
9. The dataset that changed the ladder
Kaggle publishes, daily, an official archive of episodes played between the strongest submissions — full replays, every action of both seats, with metadata:
1
2
3
kaggle datasets download kaggle/kaggriculture-episodes-2026-08-03
# 787 full replays, ~20 GB expanded
# manifest.csv: episode_id, create_time, avg_score, min_score, sum_score, ...
Two properties of this archive matter. First, it is complete at the action level: every move of every seat, replayable through the engine. Second, it is a rating-ordered selection, not a census — it contains the strongest games of the day, size-capped, which makes it a superb behavior reference and a terrible population estimate. (I learned to respect that distinction the hard way: one team looks unbeatable inside the archive — dozens of wins, no losses — while sitting below my own team on the actual leaderboard. Archive prominence is not ladder strength.)
Combine complete action logs with a game where (Part I.4) your opponent cannot touch your farm, and a very specific strategy becomes available.
10. The four-line agent
Several of the highest-scoring public notebooks contain, at their core, an agent like this:
1
2
3
4
5
TRACE_ACTIONS = [ ... 720 entries, verbatim from a recorded winning seat ... ]

def agent(obs, config=None):
    step = min(int(obs.get("step", 0) or 0), len(TRACE_ACTIONS) - 1)
    return copy.deepcopy(TRACE_ACTIONS[step])
That is the whole policy. It reads nothing from the observation except the turn number. It replays, action by action, one seat of one recorded game between two ~2,600-rated players — and it scores around 2,500 on the live ladder.
The craft, such as it is, lives in small repair overlays wrapped around the tape:
1
2
3
4
5
6
7
8
# overlay sketch #1 — weed repair at one known fragile step:
#   if step == 636 and the tile the tape wants to plant holds a WEED:
#       issue DIG now, re-issue PLANT next step, then resume the tape
#
# overlay sketch #2 — opponent fingerprint at step 300:
#   count the opponent's visible tiles once;
#   if the layout matches the opponent from the original recording,
#       re-sort my own sale orders by price for the rest of the game
One public variant even ships ten alternative sale-sorting modes in dead code — the author grid-searched the ordering strategy and froze the winner. Surgical patches over a frozen program: that is the current state of the art at the top of this ladder.
11. Why verbatim replay works — four mechanisms
I found this genuinely puzzling at first: a fixed tape, facing arbitrary opponents and fresh random seeds, should break. It does not, for four reasons I could verify directly.
(a) The game is nearly solitaire. Since no action can touch the opponent’s farm, a tape’s production program executes almost identically no matter who sits across from it. In my instrumented runs, the same tape produced one identical action-hash across different opponents and both seats — twenty-four games, one behavior. Its bank varies only through the shared market, a second-order effect.
(b) Invalid actions are silent no-ops. If a weed occupies a tile the tape wants to plant, the action simply does nothing; the engine doesn’t fault, doesn’t penalize, doesn’t drift. Weeds spawn at $p=0.005$ per empty tile per day and a good program keeps the farm full, so divergence between the recorded world and the replayed world stays tiny — and the repair overlays patch the handful of steps where it doesn’t. Randomized shop-unlock order changes town demand slightly; that too is second-order for the bank.
(c) Early-ladder rating dynamics. The leaderboard is a win-driven rating; margins don’t score. A tape recorded from a 2,600-level seat reliably beats the broad 1,000–2,400 field — my own agent included: I win about a third of games against the most beatable of these tapes and essentially none against the rest. Beat the mid-field consistently and your rating converges high — especially now, while every submission’s uncertainty is wide, teams display their best-scoring entry, and the whole ladder is inflating. I measured the bronze-cutoff score rising by more than 700 points in a single day, and the frontier itself moved from ~2,906 to ~2,929 in the day after that. Nothing about today’s numbers is stationary.
(d) The clone flood. This is the part that genuinely surprised me. I fitted the “program” of every winning seat in one day’s archive — crop-mix trajectory at five checkpoints, herd composition, expansion days, the hire curve, sale timing per product, 104 parameters in all. 95 of 104 came out near-constant across 781 winning seats — most with literally zero interquartile range. One plant-mix fingerprint — 21 melon, 44 strawberry, 66 wheat plantings — covered 87.8% of all winners (and 74.5% of losers: the same lineage loses to itself all day). Expansion on day 7 and day 10, never the fourth quadrant, twelve hands from day 10 onward, melon sold mid-game, wool and strawberry batched late — same numbers, seat after seat. The “model answer” isn’t mathematical convergence. It is one public program, forked by roughly sixty teams, playing itself up and down the top of the ladder — no single team holds more than ~5% of the winning seats, but the lineage holds nearly all of them. That is why the two farms in the Part I screenshot are mirror images.
So: is there a model answer to this game? Empirically, right now — yes, in the weak sense that a single open-loop program plus minor repairs is sufficient for the frontier. My read is that this is a phase, not an equilibrium: it works because it is early, because ratings are still inflating, and because nobody is yet punishing predictability. Which brings me to the fun part.
Aside — is this good game design? (and will it get patched?)
Let me say the quiet part plainly: a competitive AI ladder whose dominant strategy is copying a recording is not in a healthy place. The root causes are design choices, not player behavior — near-zero interaction between players, invalid actions that fail silently instead of costing anything, and a daily firehose of complete expert replays. Each is defensible alone; together they make the optimal meta “replay, don’t play.”
It is also very early — the season runs into late September — and every one of those causes has an obvious patch lever. Penalize or fault invalid actions and the silent-no-op robustness that tapes depend on disappears. Nudge a few market constants (the engine exposes them as configuration) and every frozen schedule is suddenly mistimed, while adaptive policies barely notice. Delay or trim the replay dataset and the copying pipeline starves. Add even one weak interaction channel and the solitaire assumption breaks outright.
I have no inside information about whether any of this will happen. But it shapes my strategy as a hedge: I would rather hold a structured, adaptive program that understands why the frontier program wins than hold a verbatim tape of it. If a patch lands, tapes die overnight and the understanding transfers. If no patch lands, the reverse-engineered program knowledge compounds anyway. Copying is only dominant until the rules move — and the rules have every reason to move.
12. Predictability is exploitable
A tape’s entire market schedule is knowable in advance — every buy and sell, with turns and quantities, sits in a literal Python list that can be parsed without executing a single cell:
1
2
3
4
# statically derived from one public tape (no cells executed):
#   late wheat buy program : turns 553-641, ~168 units   <- feed logistics, at peak prices
#   melon dump             : turns 262-264, 24 units     <- straight into a sq-shaped glut curve
#   wool batch             : late-game, into the same thin book as mine
If your opponent will, deterministically, buy 168 wheat late and dump 24 melons on day 11, you can position against it: sell into their buys, deepen the gluts their sales land in, withhold and re-time your own sales around their schedule. I built all three families of counter-response and ran them against the tapes under paired benchmarks. The results were not what I expected, and they reshaped how I think about this game — that is Part IV.
Part IV. Reverse-engineering the model answer
13. One game, replayed bit-exact
I took the source episode of one public tape — the day-22 board from Part I, a real ladder game between two ~2,650-rated players — and re-ran all 719 transitions through the engine, verifying zero mismatches, seeded weed rolls included. With the replay bit-exact, every dollar of the outcome can be attributed.
The two seats ran near-identical programs — 494 of 720 turns byte-identical, the same lineage on both sides of the board. Both rode the same wheat carry-trade: buy roughly a thousand units of wheat across the season while town demand walks the price from $25 to $56, sell ~880 units back at an average 1.8× base. Both dumped melon in the same window. Both drowned the milk market together — 459 combined units realizing barely half of base price, the one shared inefficiency of the whole frontier program, and a note-to-self for a future edge.
The margin was a dead heat, within $270, through day 28. Day 29 alone decided the game, +$7,256. The winner had replanted 29 wheat tiles on day 26 — $320 of seed — harvested 99 units on days 28–29, fed its herd from its own harvest, and sold the surplus into the season-end price peak at ~$56. The loser, its farm empty, bought $8,612 of feed wheat at $53–56 over the same days. Final banks: $112,154 versus $105,168. Same program, one extra late decision, entire game.
14. The gap ledger
Generalizing from one game to the whole archive: I built an additive revenue account — per-product units sold × realized prices, minus every cost line — and reconciled it against the engine’s money conservation to the dollar (attribution residual under 1% of bank) for all 781 winning seats versus my own live games. The gap came out at about $13,400 per seat, and it decomposes cleanly:
| Line | Share | What it actually is |
|---|---|---|
| Wheat cycle | 51% | They grow their feed — 66 wheat plantings across the season, including a day-25/26 replant wave sold at the late peak. I was net-buying 200+ units of feed and churning ~1,000 units of pointless buy/sell late-game |
| Strawberry volume | 16% | They hold 40 strawberry tiles from day 15; I plateau at 33. Pure production — my sale timing was already right |
| Hired-labor waste | 14% | My 13th hand costs $233/day while my workers idle 17.9% of turns; winners run 12 hands at 5.1% idle |
| Melon cadence | ~13% | They roll melon sales through the mid-game and replant a few tiles; I dump in two bursts |
Equally useful were the non-levers the account ruled out: wool price realization (identical to theirs within a dollar), land timing (identical: day 7, day 10, never the fourth quadrant), animal costs (a wash). I love this table because none of it is mystical. It is seed costs, feed logistics, tile counts, and idle hands — and it says precisely where not to spend effort.
15. The coupled-margin law
Then I implemented the “obvious” fixes and ran paired benchmarks — same opponent, same seed, same seat, candidate versus baseline, hundreds of pairs per verdict. And the market taught me the same lesson three times.
Experiment 1 — delete the churn. I removed the pointless late-game wheat buy/sell cycle. My own bank went up on average — and my win count went down, with the losses concentrated against my closest opponents. The churn had been accidentally propping up the wheat price that the tapes buy their feed at, every game, on schedule. My “waste” was a tariff on their logistics; removing it handed my nearest rivals a bigger gift than it earned me.
Experiment 2 — fix the herd, unconditionally. A herd-composition change worth +2,200 in average margin lost more close games than it flipped. Margins don’t score; wins do.
Experiment 3 — weaponize the glut. A variant that floods the steep strawberry curve does torch the tapes: it flipped games against tape opponents I had literally never beaten (their revenue falls harder than mine). But the same flood is suicide against anything adaptive — and at proper sample size it netted out at −25 wins per 768 pairs. As a bonus lesson in statistics: at small sample size this variant had looked like a breakthrough, because seven of its ten “flipped wins” came from a single lucky seed hitting seven near-identical clone opponents at once. Clones don’t just dominate the ladder — they silently destroy your effective sample size.
The law underneath all three:
\[\text{margin} = B_T^{(p)} - B_T^{(1-p)},\]and in a shared market every unit you sell moves both terms. Optimizing your own bank is not the same thing as optimizing the margin, and some of your inefficiencies are, secretly, your defense. I now refuse to delete any “waste” from the policy until a paired benchmark prices its denial value.
16. What actually survived: gated adaptation
Out of everything I tried this week, exactly one intervention was win-positive at scale — 768 paired games per candidate, both seats, fresh seeds: a detector-gated parameter switch. The policy watches a handful of public checkpoints in the first four game-days; if the opponent’s visible trajectory matches a known public lineage with near-certainty, one internal allocation parameter flips — otherwise the policy stays byte-identical to the baseline:
\[\pi(o_t)= \begin{cases} R_k\!\left(\pi_0(o_t),\,o_t\right), & Z_t=\mathrm{CONFIRMED}(k),\\[2pt] \pi_0(o_t), & \text{otherwise.} \end{cases}\]The timing works because confirmation locks long before the allocation decision it modifies comes due. On the panel it wins more games against the tape lineage (net +8 wins over 768 pairs, margin lower-confidence-bound comfortably positive), and against everything unrecognized — including a deliberate mirror of my own policy — it is provably unchanged: 240 of 240 verification games byte-identical to baseline. A small edge, but the first real one, and the shape generalizes: adapt only on evidence, default to the safe program, make the default provably intact.
The methodology mattered as much as the idea, so let me spell it out:
- Paired everything. Every candidate faces the same opponent, seed, and seat as its baseline. In a game with ±20,000 per-seed swings, unpaired comparisons are astrology.
- Zero-effect controls. Every screening batch includes detector-only agents that must measure a delta of exactly 0.0. They caught two broken measurement harnesses this week — including one that silently turned an agent into a no-op and “won” games it never played.
- Sample-size discipline. Chaos through the steep price curves puts the per-game noise floor at thousands of coins; a 4-tile layout change once swung a single game by ±20,000. My small-panel “discoveries” died at 768 pairs, twice. In this game, small-sample verdicts are fiction with confidence intervals.
17. Where the RL toolkit fits
Nothing in this note is gradient-based yet, but the scaffolding is deliberately RL-shaped: trajectories under a strict observation/action contract, faithful frozen opponents, paired off-policy-style evaluation with holdout seeds, and a 20-GB-per-day corpus of expert games — the day I analyzed decomposes into 13 million observation-action rows. The obvious next rungs sit directly on this base: behavior-cloning the frontier program instead of hand-porting its parameters one by one; learning the sale-timing policy that the market coupling rewards, where my hand-written rules are demonstrably crude; and eventually letting a learned value function price the jobs that my matcher currently prices with hand-tuned constants. The replay meta, ironically, has produced the best imitation-learning dataset I could ask for.
Part V. Where this goes
Current state, in one screen:
- a structured economic policy, public and documented, holding the top third;
- the frontier decoded: one clone lineage, its program fitted parameter-by-parameter, its $13,400 gap decomposed into four fixable lines and a list of proven non-levers;
- one validated, provably-safe adaptive edge live on the ladder — plus a deliberately “wrong-by-my-own-benchmarks” market-pressure variant running beside it as a live A/B, because the ladder’s opponent pool is not my local panel, and I want the disagreement measured rather than assumed;
- and a clear next target: labor. Every production lever I ported from the frontier program underperformed its paper value for the same reason — my workers idle 17.9% of turns and the frontier idles 5%. Until the scheduler closes that gap, the wheat wave and the 40-tile strawberry ramp are cheques the labor force can’t cash.
Part 2 will be about that: making eleven hands do the work of thirteen, what the live A/B says about local benchmarks versus the real opponent pool, and what happens to the replay meta as the ladder starts punishing predictability.
Series: Kaggriculture Working Notes — Part 1.