ARC-AGI-3 Part 2: Where a Mathematically Perfect Idea Went to Die
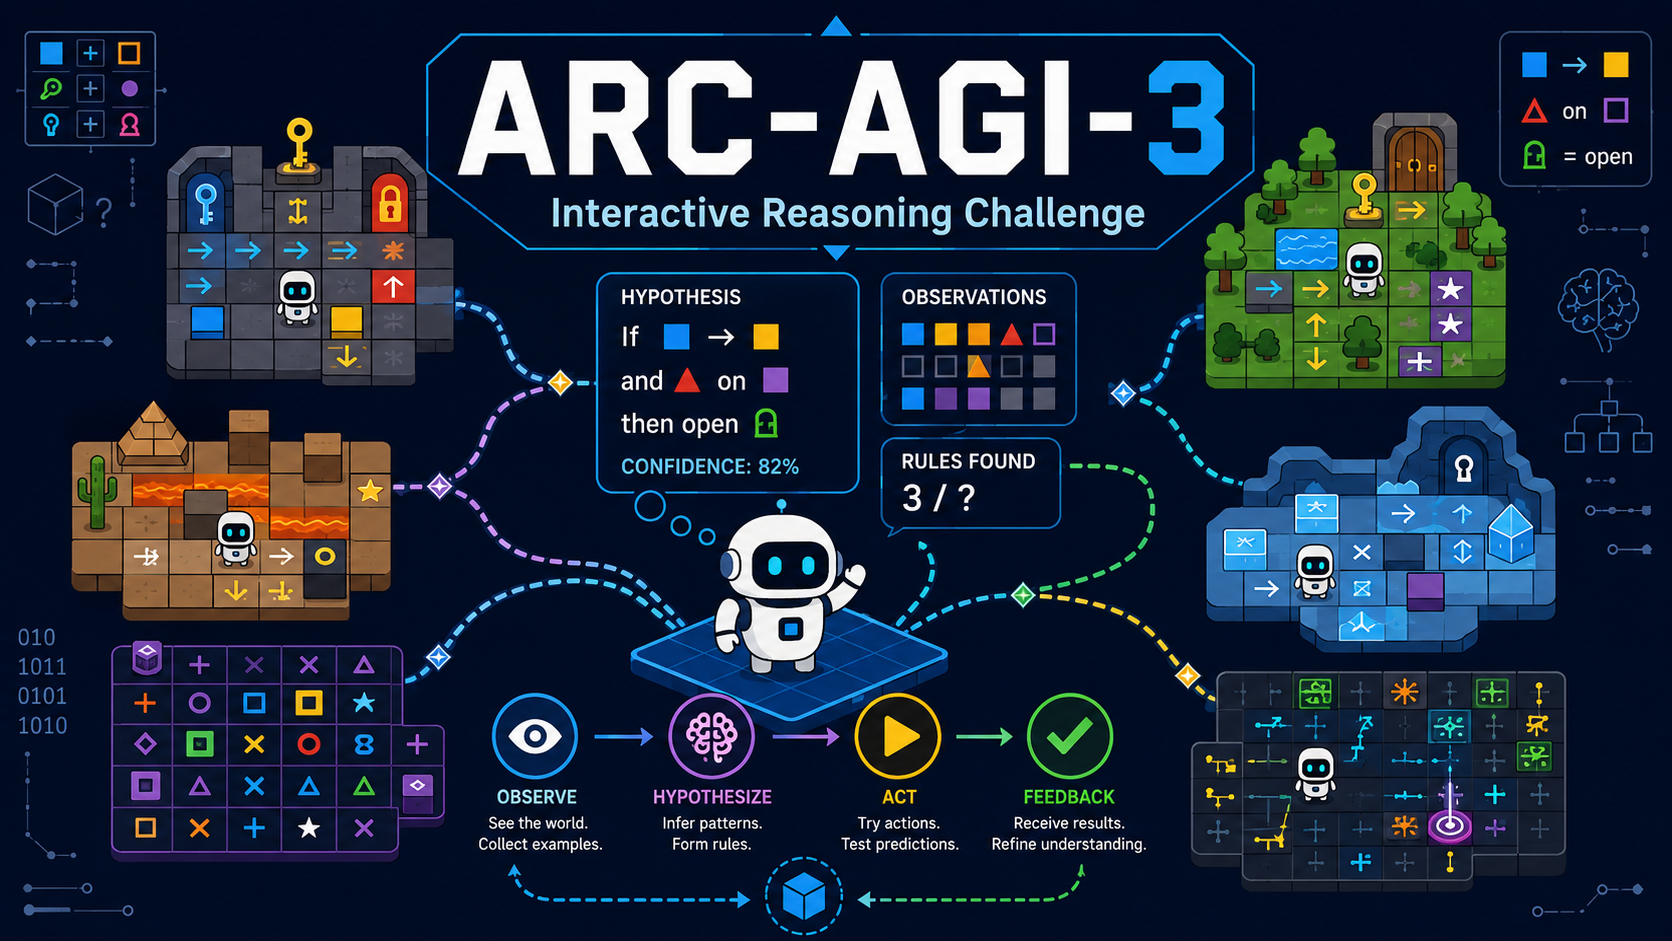
ARC-AGI-3 Working Note 2: Where a Mathematically Perfect Idea Went to Die
This is a working note. Part 1 drew a map of the competition; this is the record of six weeks spent actually walking it. Four submissions, two infrastructure accidents, and one idea that was mathematically flawless and died to a single line in the rules. The one-sentence conclusion, up front: what moved my score the most over these six weeks was not an algorithm — it was re-reading where I measure and what the rules actually permit. All numbers are as of August 4, 2026.
Part 1: ARC-AGI-3: The Benchmark Nobody Has Solved Yet
0. Four submissions, a suspiciously narrow band
I submitted four times over six weeks: 0.86 / 0.88 / 0.89 / 0.93.
At first I picked the comforting interpretation: “small sample — submit more and it will climb.” That story works if the 1.4–1.9 region above is the product of lucky draws. But watching four samples land inside a 0.07-wide band made the story harder and harder to keep, and eventually the narrow band itself became the starting point of this post. A narrow band means low variance, and low variance means the gap above me is skill, not luck. I’ll make that judgment quantitative in section 3.
Before that, two accidents worth recording, embarrassing as they are.
1. Two accidents: a silent failsafe is poison
Accident ①. My first submission (0.86) was not my agent. While creating the notebook in the Kaggle UI, the wrong dataset got attached — the stock source bundle instead of my modified one. My code was built as a ladder of failsafes: “if a dependency is missing, degrade quietly to stock behavior.” The ladder worked exactly as designed. So, with no error anywhere, a stock agent carrying none of my modifications got submitted — and I sat there evaluating my ideas against its score.
The lesson is not “don’t build failsafes.” It is: degradation may be allowed, but silent degradation must not be. The commit stage now crashes immediately if the bundle lacks my modules, and the assembled agent’s class name is verified in the log.
Accident ②. The next version ran flawlessly for seven hours and died at the final save step. The framework pickles the agent object at the end of a run, and a class I had created dynamically with type() at runtime has no module attribute for pickle to reference. The code I was extending used module-level classes for exactly that reason. Framework conventions usually have reasons, and those reasons hide not in comments but in invisible contracts like the serialization path.
The shared lesson: before testing your hypothesis, ask whether the testing pipeline itself has been tested.
2. A mathematically perfect idea, and the place it died
Now the main story. My first differentiation idea came straight from the scoring structure.
2.1 The idea: re-submit a won game, cheaper
As covered in Part 1, a level scores
\[s_\ell = \min\!\left(\left(\frac{h_\ell}{a_\ell}\right)^{2},\ 1.15\right)\]— inverse square in the action count. Halve the actions and the level score quadruples. And while reading the scoring engine that ships with the competition data, I found this:
1
2
# scorecard: one game card's score
return max(run.score for run in self.runs)
A card’s score is the maximum over its plays. The strategy then writes itself. Immediately after winning a game, open one more play of it and win again — this time without the waste. Not by naively replaying the winning trajectory, but by accumulating every observed transition $(s, a) \to s’$ into a graph and replaying the shortest path. The winning route is itself in the graph, so the shortest path can never be longer; verify every replayed step against the recorded frame, and abort on the first mismatch. Aborting is free, because the recorded win still owns the max. A score-monotone device with exactly zero downside.
I designed it, built it, and passed all nineteen unit tests. Locally, it was flawless.
2.2 Where it died: one line
Another file in the engine contained this:
1
2
3
# api: competition mode
if scorecard.competition_mode and scorecard.has_environment(game_id):
    return None, False
Competition mode refuses a second run of the same game id. The second play you would take a max over cannot exist. max(run.score for run in self.runs) is true — but in competition, self.runs always has length one. The math was perfect; one premise was false.
A footnote: the public fork I build on ships its own win-then-replay machinery of the same family. Equally dormant in competition mode, forever. Hundreds of teams copy and run that fork; I wonder how many know. Everyone runs the same code and nobody reads it — hold that observation, because it pays off again later.
2.3 The autopsy found a second cause of death
I did an autopsy before burying the idea. Even if replays had been allowed, the device would have been betrayed in half the games. Cross-checking every (board, action) pair that appeared more than once in my run logs — 760 repeated pairs — 270 of them (35.5%) produced different next states. Some games are 0%, some are 57%. There are timers and animation phases the frame does not show. Every cache built on “same board + same action = same result” collapses probabilistically right there.
Had the rules not killed the idea, the measurement would have. Only the order differed.
3. Luck or skill: a gap no lottery can close
With the idea buried, the original question remained. What is the gap between 0.9 and 1.5?
Resubmission is a statistically clean independent draw (serving temperature 0.6, random seed). The leaderboard keeps only your best, so with per-submission standard deviation $\sigma$, the expected best of $N$ submissions is approximately
\[\mathbb{E}\!\left[\max_{i \le N} S_i\right] \approx \mu + \sigma\, a_N, \qquad a_{10} \approx 1.5,\quad a_{24} \approx 1.9,\quad a_{60} \approx 2.2.\]So everything hinges on the size of $\sigma$.
This is where my four samples become evidence. A single game’s score swings wildly between attempts (I once got 0.583 / 0.444 / 0.015 from the same game, three tries). But the total is an average over 110 runs, and the central limit theorem crushes the variance. If $\sigma$ were 0.176, the probability of three samples landing within a 0.07 band is about 4%. The value consistent with observation is $\sigma \approx 0.05$–$0.10$.
Plug that in and the conclusion falls out. With $\mu = 0.89$ and $\sigma = 0.10$, submitting 24 times yields an expected best of about 1.08. The current #2 sits at 1.69 after seven submissions. The teams above are not better at the lottery; their mean $\mu$ is different. The expected gain of scratching submission slots like lottery tickets is capped at $\sigma(a_N - a_4) \approx 0.05$–$0.15$ points. It was time to stop digging there and find what raises $\mu$.
4. Measuring in the wrong place: discovering token starvation
To raise $\mu$ you need the bottleneck, and to see the bottleneck your measurement must be right. Which is where the most embarrassing discovery came from.
The execution framework that ships with the competition spells out the scored run’s structure. The hidden evaluation is 110 independent runs (containing multiple clones of the same underlying games), scheduled at concurrency 28, each capped at 7,920 seconds of wall clock. Do the arithmetic:
\[\underbrace{\left\lceil \tfrac{110}{28} \right\rceil}_{4\ \text{waves}} \times 7{,}920\,\text{s} = 31{,}680\,\text{s} \approx 9\,\text{h}, \qquad 7{,}920 = \tfrac{32{,}400}{4} - 180.\]The per-run cap is not arbitrary — it is the nine-hour budget divided into exactly four waves. The budget is already fully spent.
The real implication comes next. Twenty-eight runs share one GPU, so what a run actually receives is not time but tokens. Reproducing the exact scored conditions locally (28 cloned runs, competition mode, hidden baselines) and measuring:
\[\text{tokens/run} \approx \frac{204\ \text{tok/s} \times 7{,}920\ \text{s}}{28} \approx 5.8 \times 10^{4},\]50–60k tokens per run — roughly 30 to 150 actions. Meanwhile, I had been observing my agent in an offline 4-game commit run at ~190k tokens per run. An environment more than three times richer. The bottleneck I kept seeing there — 900-action thrash on a single level — is a phenomenon that doesn’t even have time to occur in the scored regime. What the scored regime actually showed: 13 of 28 runs (46%) clear level 1, often cheaply (8–38 actions) — and nobody reaches level 2. The problem was never waste. It was depth.
After this, I replaced the commit pipeline with the competition simulator. If the place you measure differs from the place you are scored, every A/B built on top is noise.
5. v6: one gap the rules left open, one bug nobody saw
From the wreckage of the dead idea, two things were salvaged. They are what this week’s submission (v6) contains.
5.1 Cross-clone transfer — the legal detour around the replay ban
You cannot play the same game twice. But the scored run contains multiple clones of the same underlying game, and clones carry distinct game ids, so they don’t trip the second-run refusal. So move the experience not across time, but across clones.
- The first clone of a family (the scout) publishes a waste-stripped action segment to a process-global store each time it clears a level.
- Sibling clones replay that segment on their own (single) run, verifying every step; the first divergence aborts back to the normal loop — so on the non-deterministic games of §2.3, it switches itself off early.
- A scheduler dispatches each family’s scout ahead of its siblings.
The skeleton of this machinery already existed in the public fork I build on. It just was never armed. The observation from §2.2 returns here — hundreds of teams copy and run this code, and almost none has flipped the lever sleeping inside it. The cheaper copying is, the more the act of actually reading the code is worth.
5.2 The memory mechanism that never once fired
The harness contains a designed long-term memory that survives context eviction: each turn, the model is asked to write labeled note lines (World model:, Plan:, …), which are harvested from the response and re-injected into later prompts as “the working world model carried from earlier turns.” But the harvest reads only the response’s content field — and a reasoning-parsing serving stack returns the model’s entire output in reasoning, leaving content empty. In my logs, 465 out of 465 responses had zero content characters. The memory mechanism has never fired. Not once since launch.
The fix is a single patch point: at the one gateway every response passes through, if content is empty and the reasoning parses to labeled notes, surface just those lines. One trap, caught by an adversarial review after implementation: the label parser is greedy — unlabeled follow-on lines keep gluing onto the previous label — so the 1,709 characters of chain-of-thought following a Plan: line would have been harvested as “the plan,” turning the bug fix into a machine that injects two kilobytes of noise into every prompt. It now carries a 280-character per-key cap.
External evidence that this repair is worth having arrived on cue. On July 29, OpenAI reported that its official evaluation harness — which discarded reasoning after every move and truncated history — was costing GPT-5.6 Sol most of its score: enabling “retained reasoning” and “compaction,” two settings, took the public-set score from 13.3% to 38.3%, with zero weight changes. The bottleneck of this benchmark is not model size but continuity of memory — the same story my logs told.
6. Where to dig next: a plan derived, not felt
This section is the real reason I wrote this post. Eight weeks remain until Milestone #2 (September 30). Here is how I am allocating them — derived from the score’s structure rather than from intuition.
6.1 The objective: μ, not σ
Restating §3’s conclusion: resubmission’s expected gain is $\sigma(a_N - a_4) \le 0.15$ points, while the gap to the top is 0.5–0.9. Anything that harvests σ is now worthless; only things that raise μ have value. Submissions are the final stage of hypothesis testing, nothing else.
6.2 Decompose the score and the priorities fall out
A game’s score is a level-weighted average: in an $n$-level game, level $\ell$ carries weight $\ell / \sum_{k=1}^{n} k$. For a typical $n = 7$ the denominator is 28, so clearing level 1 perfectly, at human efficiency earns just $1/28 \approx 3.6\%$ of that game. Level 2 adds twice that: 7.1%.
Put §4’s measurements into this arithmetic (L1 clear rate 46%, L2 reach 0%) and the entire leaderboard explains itself. Roughly:
\[S \approx 100 \times \mathbb{E}_{\text{games}}\!\left[ \frac{p_1 s_1 \cdot 1 + p_2 s_2 \cdot 2 + \cdots}{\sum_\ell \ell} \right].\]- Us today: $p_1 \approx 0.46$, erratic $s_1$, $p_2 \approx 0$ → total ~0.9. Checks out.
- Clear only L1, but on every game at human efficiency ($p_1 = 1, s_1 = 1$): $1/\Sigma\ell \approx 3$–$5\%$ per game → total ~3.5. Nearly double the current leader (1.86).
- Add L2 half the time: ~5–6.
The frontier of this competition is not exotic technology. It is “clear level 1 cheaply everywhere, sometimes reach level 2.” The marginal-gain ordering follows: ① L1 clear rate (from 46%), ② L1 efficiency, ③ L2 reach — and the fact that ③ carries double ①’s weight, combined with token starvation, produces the priority list below.
6.3 Three digs, and why in this order
Under a ~100-action-per-run budget, I see exactly three levers on those marginal gains.
Dig 1: memory continuity (in progress). The main cause of failed L1 clears is not missing knowledge but evaporating knowledge — rules the model worked out vanish with eviction, and the remaining budget re-derives them. Repairing the dead channel (§5.2) is the first fix; the next step is replacing eviction with summarizing compaction. Evidence: Sol’s 3× (external), our 465/465 (internal). Cost: low — harness patches. Verification: watch the carried-world-model block’s contents and the L1 clear rate in the simulator.
Dig 2: cross-clone transfer (in progress). The bottleneck on L2 is not capability but budget — L1 eats most of it. When a scout’s segment lets a sibling replay through L1, the sibling’s 50–60k tokens become pure L2 budget, transferred into the double-weight region — the largest marginal gain in §6.2’s arithmetic. Evidence: offline validation replayed 5 published segments into fresh instances, 5/5 cleared. Risk: if the clone fingerprint misses on the hidden set, the whole layer degrades to a no-op — I verified the zero-downside design. Verification: publish/adopt events and the L2-reach distribution in the simulator.
Dig 3: token throughput (armed trigger, waiting). In a token-starved regime, tokens per second is the amount of thinking a run gets to do. Blackwell-native 4-bit (NVFP4) weights for our model would raise it meaningfully — traded against quantization quality, so it does not move without measurement. The trigger (public weights appearing) is defined; until then, watch.
The logic of the ordering: digs 1 and 2 are repairs and reallocations of things we already have — low cost, fast verification, and they multiply (better memory means scouts clear more; scouts clearing more means more to transfer). Dig 3 is a multiplicative constant whose trigger is external.
6.4 What I am explicitly not doing, and why
| Discarded | Reason |
|---|---|
| Resubmission lotteries | $\sigma \approx 0.05$–$0.10$; expected gain capped at 0.15 (§6.1). |
| Anything replay-banking shaped | Competition mode refuses the second run (§2.2). Closed until the rules change. |
| Naive transition caches | 35.5% of visible states are non-deterministic (§2.3); needs animation signatures first. |
| Bigger context windows | The KV cache is already ~5× oversubscribed at 28 runs × 32k context. Growing it kills throughput. |
| Bigger models | Same reason. Under token starvation, parameters trade against throughput. |
| Tuning on the 4-game offline commit | An environment 3× richer than the scored one (§4). Noise, not measurement. |
6.5 Schedule (backwards from M2)
- Now–week 1: measure v6. From the simulator and the submission: transfer publish/adopt rates, the revived memory channel’s actual contents, L1 clear rate and L2-reach distributions. This commit already produced the first ten segment publishes ever observed.
- Weeks 2–4: deepen dig 1 (eviction → compaction); variant of dig 2 for non-deterministic families (transfer learned rules as text instead of actions). Every variant must pass a simulator A/B before it earns a submission.
- Weeks 5–7: converge on the measured winners; watch the NVFP4 trigger; start offline distillation of a small action prior from public-game trajectories.
- Week 8: freeze. No new ideas in the final approach to M2 — the same principle I wrote down in Part 1.
7. Three lines of lessons
Six weeks, compressed:
- Verify the pipeline first. Both accidents happened in the plumbing, not the ideas — and silent failsafes hid them.
- Math is only as good as premises, and the rules set the premises. One line of the scoring engine voided a flawless design; a different structural fact (the clones) opened a legal detour. Read the system, not the leaderboard.
- If the measurement point is wrong, everything above it is wrong. Only after aligning where I measure with where I am scored (token starvation, 110 runs, clones) did the real bottleneck become visible — depth, not waste.
The next post will most likely be the measured results of transfer and the memory channel. Whichever way the numbers fall, I will write them down.
Resources
- ARC Prize 2026 - ARC-AGI-3 on Kaggle
- Scoring methodology · Milestone #1 official results
- Duck harness code
- Official GPT-5.6 Sol results and how two settings tripled it (the-decoder)
- Executable World Models for ARC-AGI-3 · Tycho · Explore Before You Solve
- The Schema harness report — self-reported, not verified by ARC Prize