Gemma 4 Developer Agent, Part 2: Measuring an Agent While Its Evaluator Moved
What a month of coding-agent experiments revealed about repeated tool calls, changing evaluators, local-to-hosted comparisons, and the risk of a twelve-hour deadline.
Part 1 followed an issue from code inspection to a verified patch and proposed a first experiment. A month of runs has exposed failures at each step. Some attempts never reached a useful edit; others produced patches that failed verification. Meanwhile, the software running and grading those attempts changed. When a score moved, we therefore had to ask which part of the system had changed—and what evidence would justify calling it an agent improvement.
The investigation has two levels. Within an attempt, we can inspect calls, errors, edits, and checks. Across attempts, we must compare results whose runtime, task population, and exposure history may differ. Four findings connect those levels:
- Identical calls cluster into long loops. In one 22-task comparison, the chance of repeating the previous call was 0.056 at the start of a streak without thinking. Among streaks already three calls long, the pooled continuation rate was 0.97. A constant repeat rate misses this pattern, although the curve alone does not establish its cause.
- Context admission can be checked exactly. One loop made 55 identical calls before the next request was rejected. Counting the initial call separately from the 54 additional calls makes the token arithmetic match the trace.
- The same package can receive different hosted scores. One byte-identical package scored 0.10 and 0.15 within the same observed host epoch. That is a recorded spread, not enough data to estimate a universal noise level or a minimum detectable gain.
- Completion matters as much as repair rate. The twelve-hour limit can invalidate a whole submission. A slower agent may solve more individual tasks yet have less chance of producing a scored run. Local timing can expose a risk; it cannot measure the hidden server’s remaining headroom.
Our working reference, recorded as E0052, is the public Budget-Fit single-agent package, kept unchanged and credited to its author. It is separate from Part 1’s unscored teaching example and from the earlier diagnostic configurations examined below. Its highest recorded Public score is 0.18. No tested variant has yet exceeded that score in our hosted records. To interpret that result, we need to keep the agent design, task population, execution variation, and runtime in view; the available scores do not separate their contributions.
The project records below were reviewed on October 23, 2026 (KST). Dated leaderboard snapshots and historical comparisons retain their original cutoffs. A new E4B submission made at 09:01 KST on October 23 is pending in the retained record; it has no performance result yet. The competition ends on December 2 at 23:59 UTC (December 3, 08:59 KST).
Where things stand
The October 22, 06:15 UTC Public leaderboard snapshot contains 3,428 teams with scores. Four share the top score of 0.24. The highest observed score has stayed at 0.24 since October 2; that does not mean the membership of the leading group has stayed fixed. This team appears at 0.18, rank 398 in that snapshot.
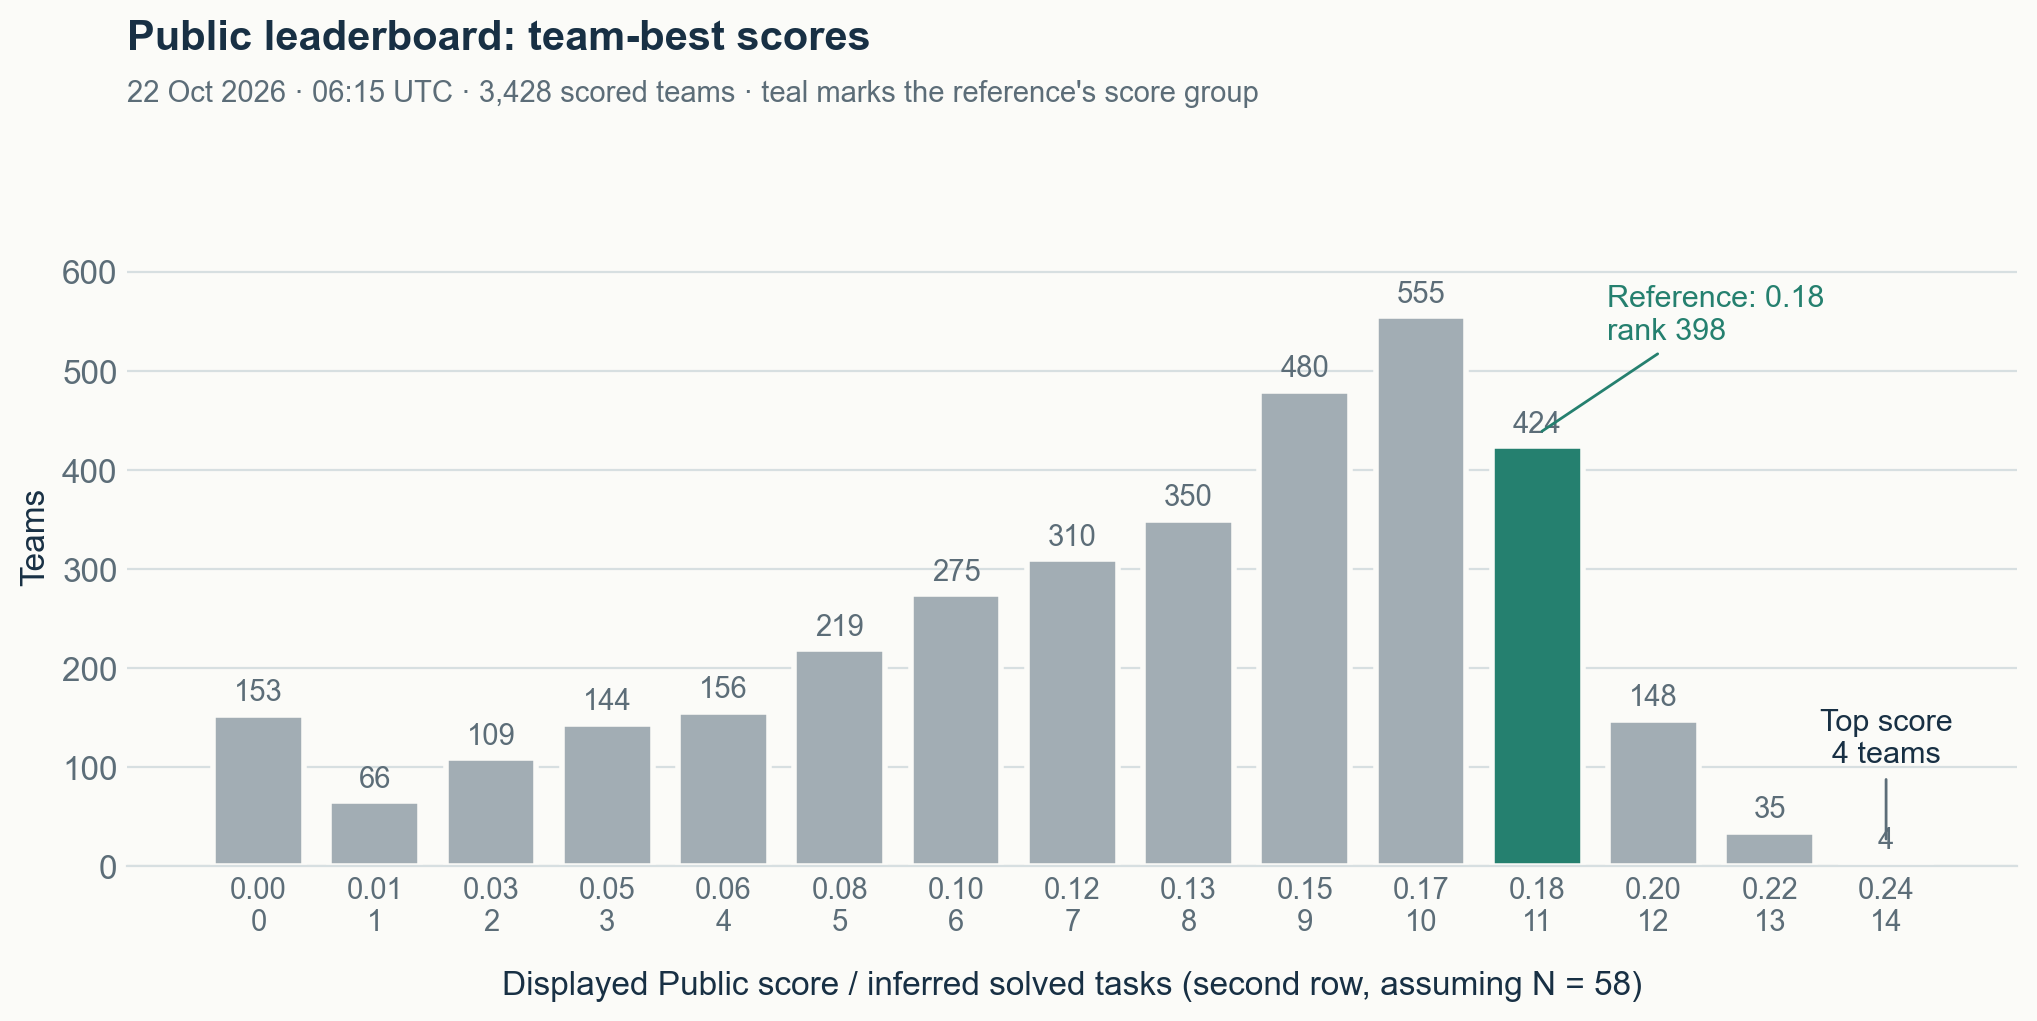 Figure 1. Team-best Public scores in the October 22, 06:15 UTC snapshot. The second row gives task-count equivalents if the Public denominator is 58 and the display truncates to two decimals. Section 7 explains why that is a working interpretation rather than a disclosed host specification. Teal marks our team’s score group, matching the Budget-Fit reference in Figure 2.
Under that interpretation, 0.18 corresponds to 11 solves and 0.24 to 14. There are 1,459 teams at the three displayed levels equivalent to 9, 10, or 11 solves. This gap between recorded team-best scores is useful context, but it does not measure a three-task difference between the candidates’ expected performance.
1. Tracking a changing evaluator
Part 1 documented the specification we inspected on September 25 and warned that it could change. Since then the host has published ten further wheelhouse versions, re-released the data, and answered several open questions. These updates affect different parts of an attempt: the model’s tool-call interface, the work preserved after an error, the patch admitted to verification, and the available model choices. The important changes are:
Table 1. Evaluator and rule changes relevant to comparing runs.
| September 25 | October 23 |
|---|---|
Evaluator swegemma 0.2.7, adk-submission 0.2.11, vLLM 0.19.1. | swegemma 0.2.11, adk-submission 0.2.13. vLLM is still labelled 0.19.1, but it was rebuilt twice under that same version number. |
| Half of the graph and embedding files were empty. | Fixed on September 25. Async functions are still missing from the graphs; the host says no hidden task depends on one. |
| An agent’s edits to existing tests could survive grading. | In the October 8 v29 release, protected test/config sections are removed from the agent patch before it is applied; the grader also resets tracked test paths. |
| An undeclared or failing tool call ended the task and lost its work. | Since October 8, tool errors are returned to the model and the session continues. |
include_thoughts: false turns thinking off; thinking_budget is ignored. | In the inspected current bridge, a positive thinking budget enables thinking and the budget is forwarded. include_thoughts: false controls retention of earlier thoughts in the history, independently of enabling thinking. |
| Tool results reached the model encoded twice as JSON; thoughts were dropped between tool calls. | Both fixed on September 30. |
| LoRA adapters were reported to load without effect. | Fixed on September 27. The host reports that adapters up to rank 64 have scored. |
| Only the 31B model. | 31B, 12B, E4B and E2B QAT variants, one base model per submission. A USD 10,000 bonus was added on October 20 for entries using E2B or E4B. |
| Distillation from other models: answer pending. | Allowed within the source models’ licences, including trajectories from other open models. |
| Overrunning the 12-hour limit errors the submission. | Unchanged. The host considered scoring unfinished tasks as zero, then said the current rule stands. |
| About 120 hidden tasks. | Staff describe about 60 Public and 60 Private tasks, from private repositories. The published runner processes the splits in one evaluation. Staff retained tasks a strong commercial model solved or missed by one assertion—a solvability filter, not a claim that all tasks are hard for that model. |
A team can also have only one submission pending at a time, and the queue before scoring has ranged from about 14 to 33 hours.
Some changes can affect even an unchanged package; others concern documentation or artifact publication alone. We group observations into host epochs, defined here by public artifact boundaries, so that a score remains attached to the environment we could observe. We write it as $S_e(b)$ for bundle $b$ in observed epoch $e$. Matching epochs gives a more defensible starting point for a direct comparison, while the private serving conditions remain partly unobserved.
Write $[t_s, t_c]$ for the interval from a submission to the first observation of its score, and $b_k$ for the publication time of the artifact that starts epoch $k$. The scorer’s actual adoption time is not observable. Our bookkeeping adds a six-hour adoption margin $\delta$; this is a conservative convention, not an observed upper bound on deployment delay. A score is assigned to epoch $k$ only if
\[b_k + \delta \le t_s \quad\text{and}\quad t_c < b_{k+1}.\]Scores outside that window remain in the history, but we exclude them from epoch-matched bundle comparisons. The rule produces eleven project-defined epochs between September 23 and October 13. Public artifact changes need interpretation too: the last boundary was triggered by recreated file timestamps, yet a subsequent comparison found all 507 bulk files byte-identical and no new task content. An earlier README differed from our old local copy. The eleven groups therefore describe our observation history; they do not establish eleven distinct private scorers.
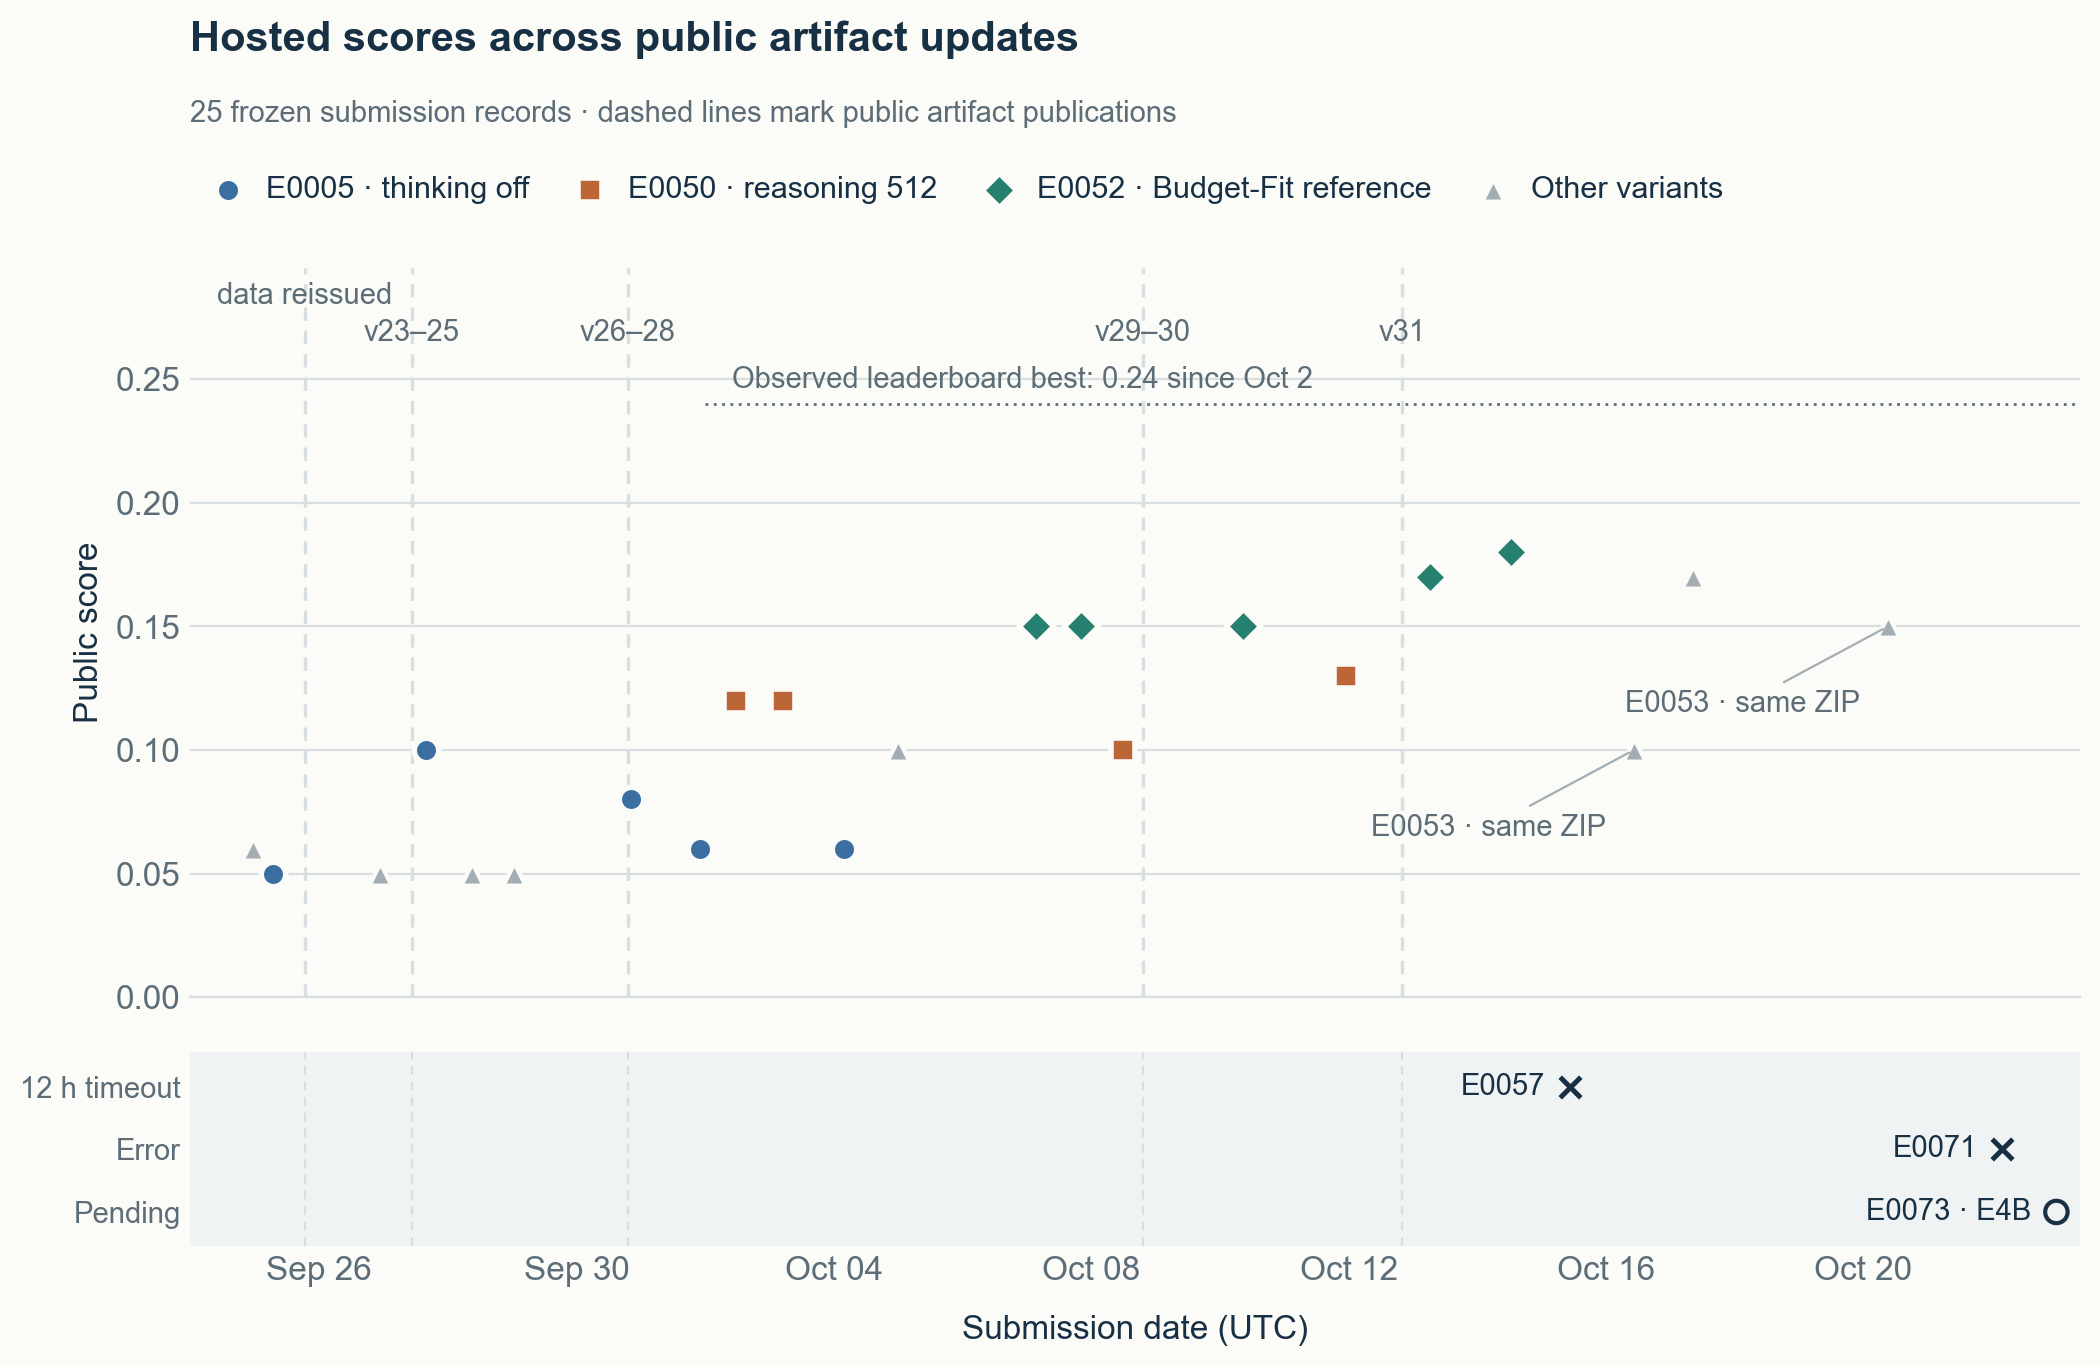 Figure 2. Twenty-five submission records through October 23, plotted by submission time (UTC): 22 completed, two errored, one pending; errors and pending submissions occupy a separate categorical strip below the score panel. Dashed lines show selected public artifact updates, not observed private deployment times. v29 and v30 share a marker. The two E0053 points identify the same ZIP. The E4B submission is pending; the unchanged early recovery package spans several periods and its scores must not be pooled as same-environment repeats.
Version numbers do not identify an epoch, because the host rebuilt swegemma 0.2.11 and vLLM 0.19.1 on October 12 without changing either number. Local evaluator builds are therefore identified by file hashes. Every local result also records a fingerprint of the server command, package digests, compaction settings and data revision.
With those boundaries recorded, we can turn to the failures inside an attempt. The distinction matters throughout the rest of the article: a trace can explain how one run failed, while a comparison needs evidence that its conditions were matched.
2. The expected score as a failure chain
Consider a fixed set of $N$ tasks and its raw solve fraction $S$. For task $i$, let $E_i$ mean that execution delivers the intended working-tree patch to verification rather than losing it through an execution or collection failure, and let $Y_i\in{0,1}$ be the binary verifier outcome. If a lost-patch path gives no resolution, the expected solve fraction decomposes as
\[\mathbb{E}[S]=\frac{1}{N}\sum_{i=1}^{N}\Pr(E_i)\,\Pr(Y_i=1\mid E_i).\]The first factor concerns delivery; the second concerns whether the delivered patch resolves the task. Reading an error flag alone cannot tell us which factor failed. In the early inspected runtime, an outer exception could bypass patch capture. In the current v31 code, general run errors are recorded and fallback diff collection still runs; verification can return resolved even when an agent error is present. A timeout or context error can interrupt an investigation while preserving an already useful patch. We therefore inspect the collected patch and verifier result separately, including collection failures. This task-level decomposition leaves the risk of losing an entire submission to Section 9.
The first run on Kaggle’s four L4 GPUs had three public tasks. One was resolved. One ended in a context error after 55 identical malformed calls. In the third, a delegated analysis agent repeated one broken shell pipeline for about four minutes until the notebook’s overall time limit interrupted it, so no edit was made. Neither reached a useful source edit, so these cases first call for investigation of tool execution and control flow. The next two sections examine how a malformed call can become a long, expensive failure before repair quality is even tested.
3. Malformed calls are a grammar problem
Gemma 4 does not emit tool calls as JSON. The serving parser expects a compact format in which a special token, written here as <|"|>, opens and closes every string value:
1
2
intended: read_file{filepath:<|"|>fastapi/openapi/utils.py<|"|>,start_line:400,end_line:568}
emitted:  read_file{filepath:<|"|>fastapi/openapi/utils.py\",start_line\":400<|"|>,end_line:568}
The second line is reconstructed from the recorded arguments, since raw tokens were not retained. The parser reads a string value until the next delimiter token. If the model closes the path with an ordinary quote, an escaped quote or a backtick, the following text, ",start_line":400, becomes part of the path. The tool then reports a missing file. The error names the path and not the quoting, so the observation does not point to the cause.
In the 22-task comparison of Section 5, the bundle without reasoning produced 223 such malformed calls, and 80 calls were rejected for missing arguments. A typical case is an edit_file call whose new_string was closed with a backtick, so that the parser absorbed old_string.
4. Longer streaks have higher continuation rates
A malformed call can be followed by its error and then by the same call again. Counting all repeated calls together hides an important question: does repetition look the same at the beginning of a streak and after it has already lasted several calls? Here an identical call has the same tool name and the same parsed argument values; argument-key order is normalized. Reading the same file with different line ranges therefore counts as a different call. Let $k$ be the length of the current streak of identical calls within one run, and define
\[h(k) = \Pr(\text{next call identical} \mid \text{current streak } k).\]A memoryless process has $h(k) = q$ for every $k$. The traces of 22 tasks run without reasoning (1,404 calls) give a very different curve:
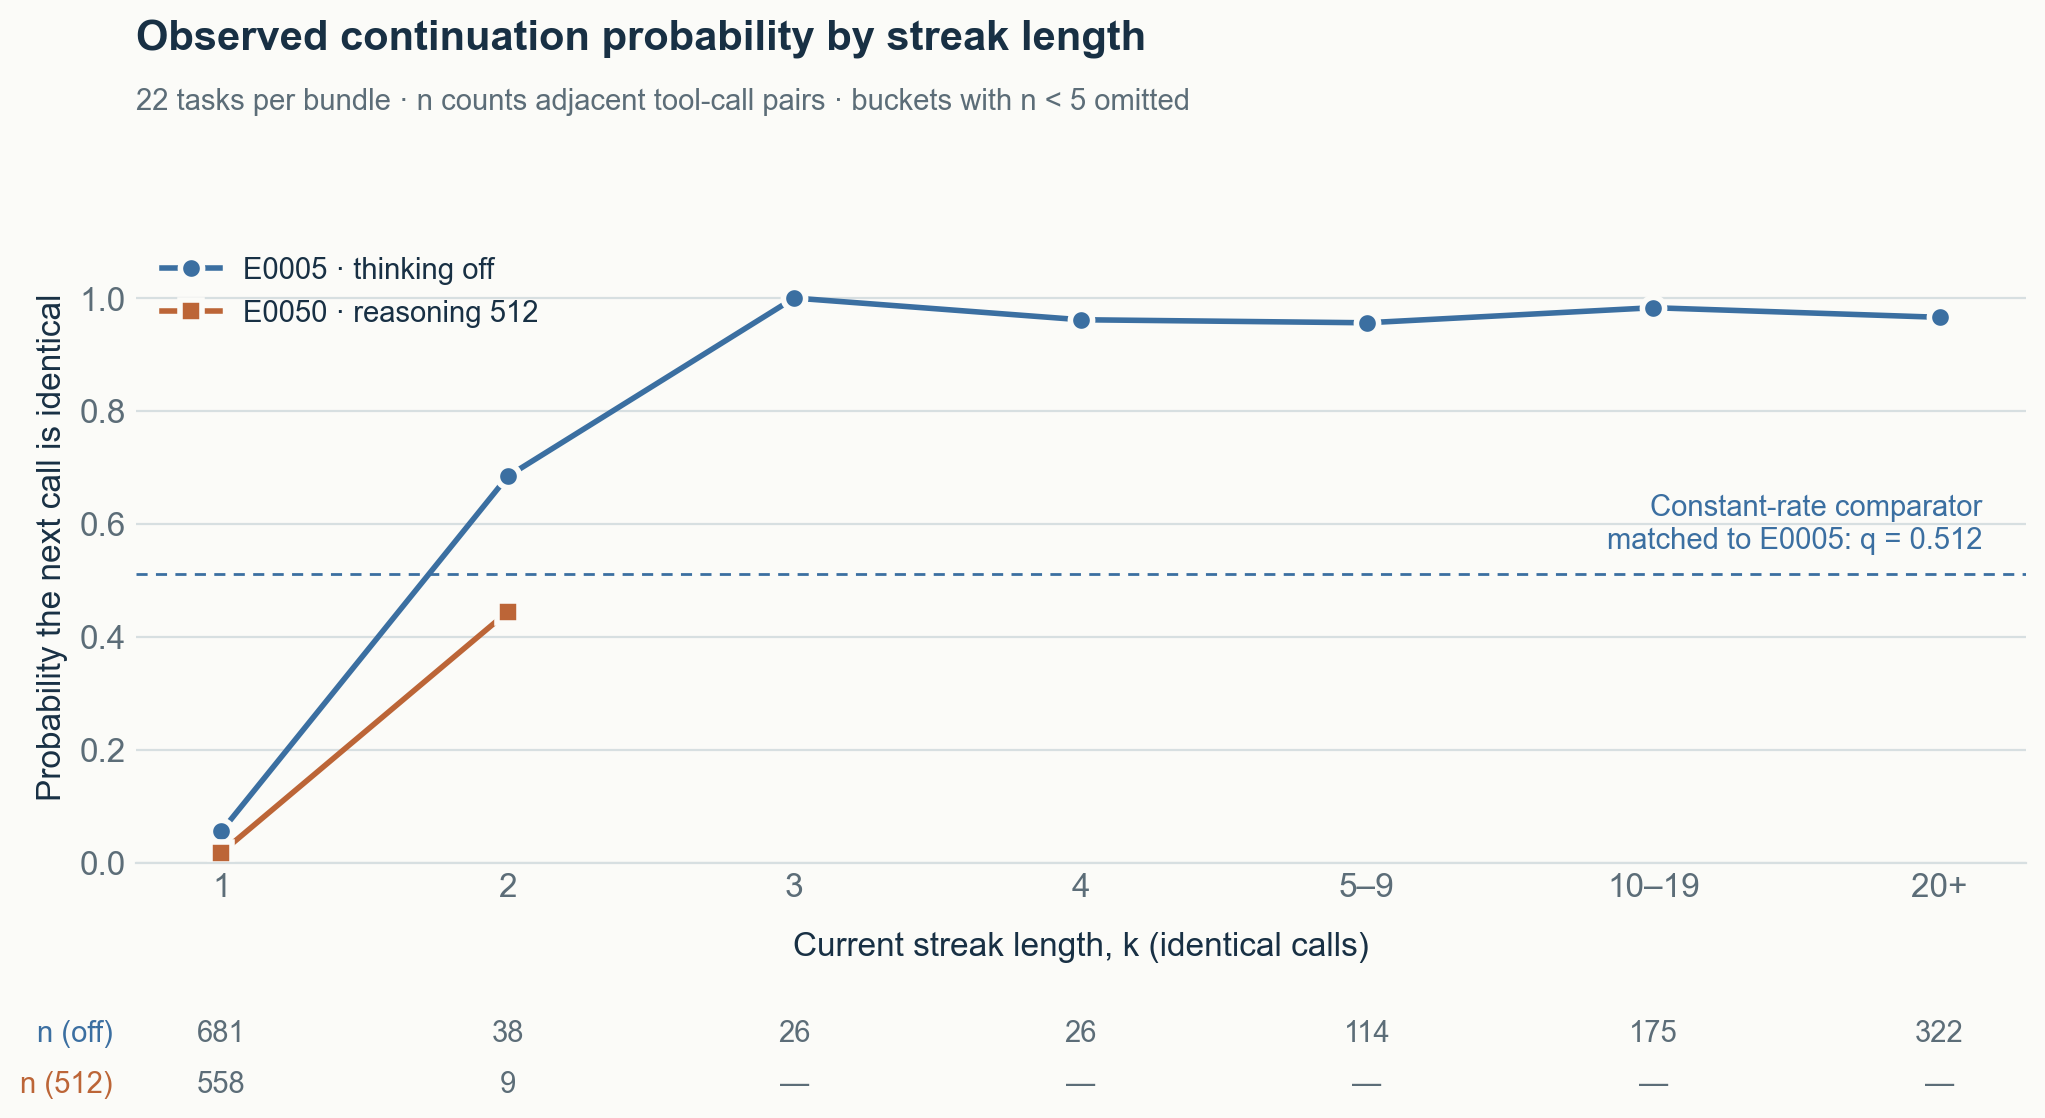 Figure 3. Empirical $h(k)$ for the same 22 tasks without reasoning (blue) and with reasoning capped at 512 tokens per call (orange; buckets with fewer than five observations omitted). The dashed line is the constant rate that matches the blue average. Counts are numbers of consecutive call pairs.
The observed continuation rate changes sharply with streak length. At $k=1$, $h(1)=0.056$. After three identical calls, $h(k)$ stays between 0.96 and 1.00; pooled over $k \ge 3$ it is $643/663 = 0.97$. Pooling here means counting the relevant consecutive call pairs across the 22 runs.
The average repeat rate over all consecutive pairs is $\hat q = 0.512$. A memoryless model with that rate predicts how often a run should contain a streak of twenty or more identical calls. Computing that probability exactly for each run’s length and summing gives an expected $1.5 \times 10^{-3}$ such runs among the 22. Eleven were observed. This is inconsistent with a useful fit from one homogeneous repeat rate. A compact descriptive model separates:
- an entry probability $\alpha = h(1)$;
- a persistence probability $\beta \approx h(k)$ for $k \ge 3$.
Under a constant-continuation model, a streak continuing at rate $\beta$ has $\beta/(1-\beta)$ expected further repeats—about 32 calls for $\beta = 0.97$. That gives a useful description of the cost of persistence. Its cause is still open: heterogeneous tasks, survivor selection, and limits that end traces can also shape a pooled curve, so these summaries do not establish a causal two-state model. In-context copying is one possible mechanism. In the inspected loops, earlier identical calls and their unchanged tool results remained in history, with no intervening reasoning text.
Admission arithmetic. Repetition has a second cost beyond wasted calls. Each completed call and tool result becomes part of a later prompt, using the context needed to continue investigating. A request is admitted only if
\[C_{\mathrm{prompt}} + M_{\mathrm{requested}} \le 32{,}768,\]where $M_{\mathrm{requested}}$ is the configured output allowance, not the length of the eventual response. Assume the first call fits at prompt length $C_0$, no compaction runs during the streak, and each completed call adds $c$ tokens to the next prompt. Then the total number of admitted calls—including the first—is
\[n_{\max} = 1 + \left\lfloor \frac{32{,}768 - M_{\mathrm{requested}} - C_0}{c} \right\rfloor.\]In the first diagnostic, $M_{\mathrm{requested}} = 8{,}192$, the loop began at $C_0 = 18{,}033$, and each repeat added $c = 119$ tokens. The floor alone is 54: after the initial call, 54 more fit. Thus $n_{\max} = 55$. The run made 55 identical calls; the 56th request, at 24,578 prompt tokens, was rejected. In a later run with $M_{\mathrm{requested}} = 4{,}096$, the rejected request had 28,673 prompt tokens, one more than the 28,672 the limit allows. With $\beta = 0.97$, a hypothetical constant-continuation streak survives 55 further transitions with probability $0.97^{55} \approx 0.19$. This illustrates the constant-continuation model rather than estimating a task-level failure probability. A finite loop can still exhaust the context available for further investigation.
5. Reasoning trades calls for reliability
A historical paired comparison lets us examine whether a small reasoning allowance changes this failure pattern. The early recovery bundle (E0005) had thinking disabled in a way that, under the late-September wheelhouse, produced no reasoning tokens at all. Its paired variant (E0050) changed one setting: reasoning enabled and capped at 512 tokens per model call. Prompts, tools, limits, runtime and sampling were otherwise identical, on the same 22 public tasks:
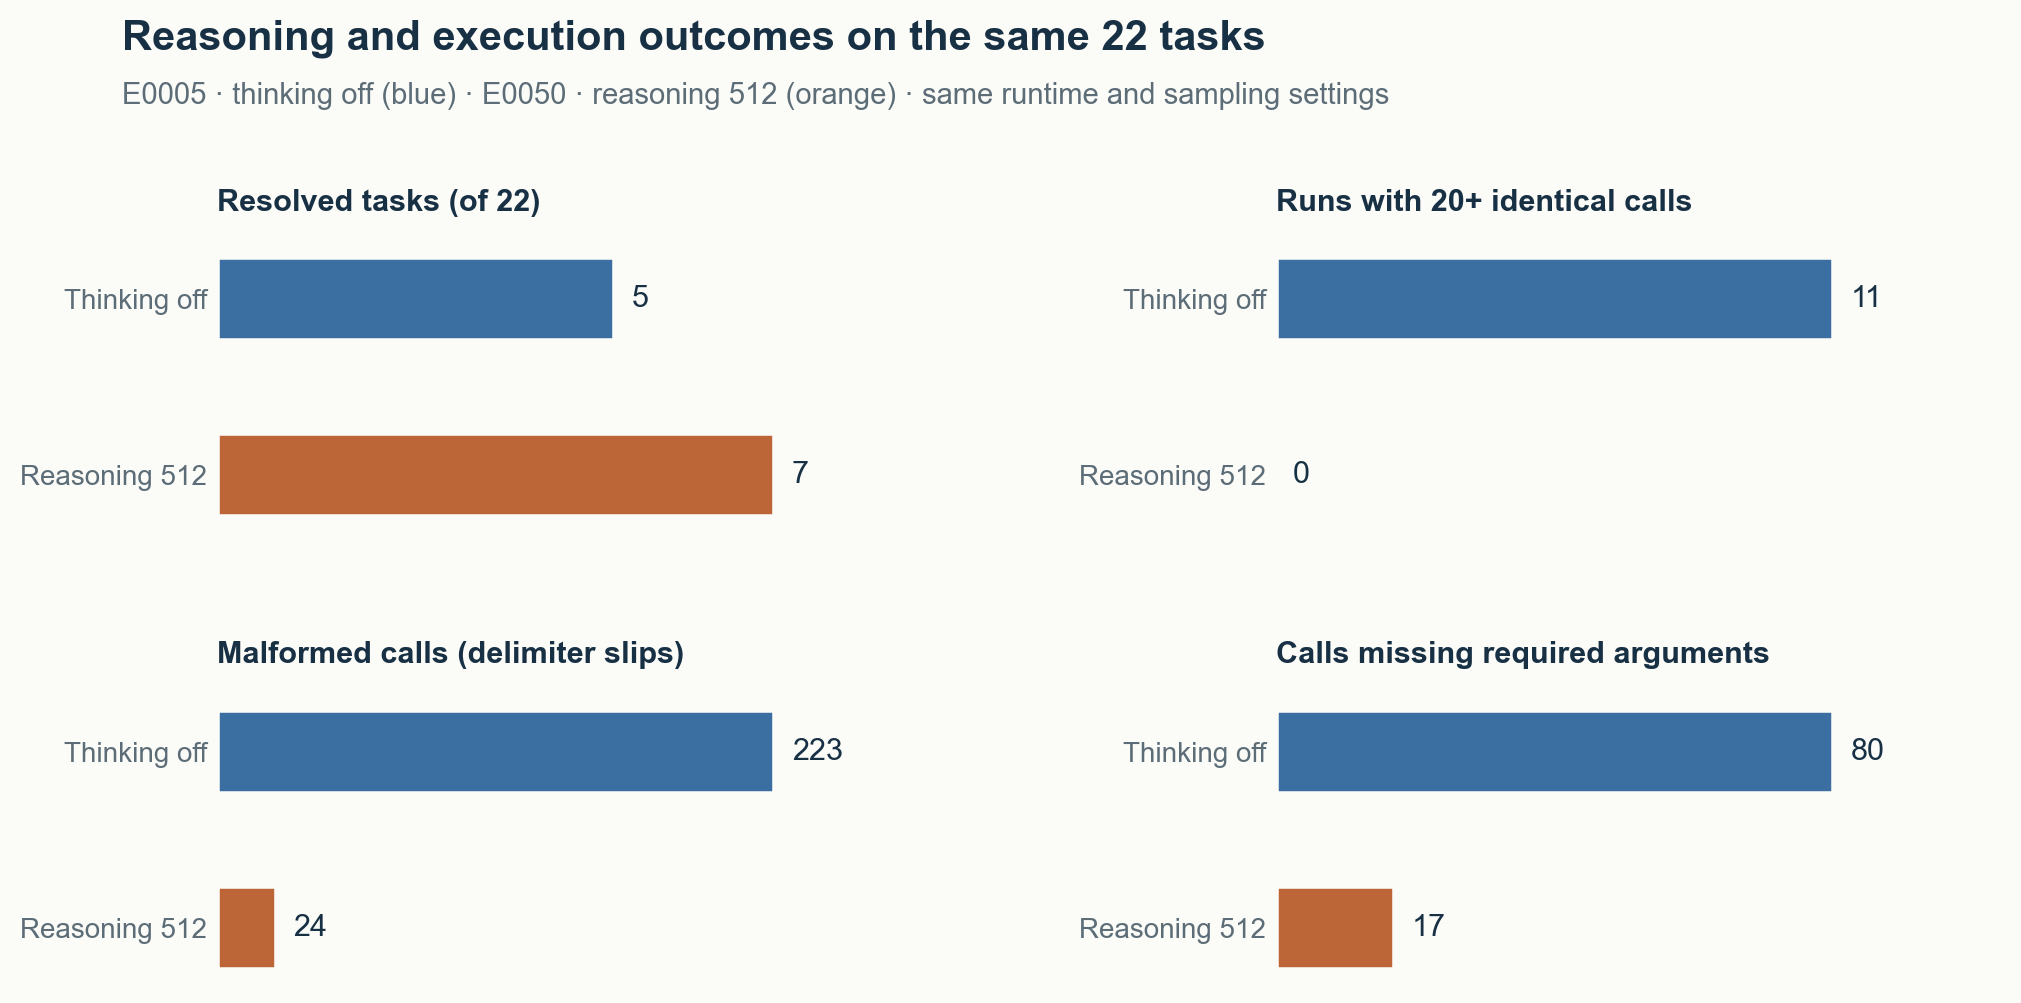 Figure 4. The same 22 public tasks, the same runtime and sampling settings. The two bundles differ only in their reasoning setting.
The resolved count moved from 5 to 7, with two discordant tasks, both in favor of reasoning. That alone is weak evidence: the exact two-sided test gives $p = 0.5$. The call-level measures changed much more visibly. In terms of Section 4:
Table 2. Repetition and patch capture in the same 22-task comparison.
| Quantity | Thinking off | Reasoning 512 |
|---|---|---|
| Entry probability $\alpha = h(1)$ | 0.056 | 0.018 |
| Persistence $\beta$, pooled over $k \ge 2$ | 0.95 | 0.47 |
| Expected further repeats after two identical calls, $\beta/(1-\beta)$ | 21 | 0.9 |
| Runs with a streak of 20 or more | 11 | 0 |
| Captured patches | 9 | 15 |
Persistence is pooled over $k \ge 2$ because the reasoning bundle has only 17 pairs beyond $k = 1$: $\beta = 8/17$ with reasoning and $669/701$ without. In this comparison the entry rate was roughly one third as large and the pooled continuation rate was much lower. The expectation row applies the constant-continuation model from Section 4 after entry into repetition. These are repeated call-pair observations, not independent task samples.
The cost is time. Model requests took 7.2 seconds with reasoning and 3.3 without on the local hardware. For a session of length $T_{\mathrm{session}}$, the number of model requests $K_{\mathrm{calls}}$ is roughly
\[K_{\mathrm{calls}} \approx \frac{T_{\mathrm{session}}}{t_{\mathrm{request}}},\]so the request latency alone would roughly halve $K_{\mathrm{calls}}$; tool time also consumes the session. The exact trace counts are 1,382 consecutive pairs with 707 repeats without thinking, and 575 pairs with 18 repeats with it. Counting the first call of each run, removing consecutive duplicates leaves 697 versus 579 calls. Total calls fell by 57%, while this less-redundant-call count fell by about 17%. A non-repeated call is not necessarily useful; it is only a better proxy than raw call count.
More thinking was not uniformly better in the runs examined. A variant whose reasoning was effectively uncapped, with a five-minute session, timed out on 15 of 22 tasks locally and scored 0.05 on the host. The capped version scored 0.12 twice, against 0.06 for the unchanged bundle in the same epoch. This is one historical case where the observed local and hosted ordering agreed. It does not establish a transferable optimum for later runtime versions.
6. The local instrument must be validated before it measures
The reasoning comparison used local traces and verifier outcomes to distinguish two configurations. That only works if the local route exposes the model to the intended files and grades the patch it actually made. Several early results showed why we had to check that route before interpreting agent behavior:
Table 3. Apparent agent results traced to benchmark or verifier behavior.
| What looked like an agent result | What it actually was |
|---|---|
| Graph tools never helped in the early local batches. | Graph files were deployed under task names, while the official resolver reads files named by repository and commit. The tools had no data in those runs. |
| Some runs hung for 190–600 seconds. | A vLLM admission rule on the smaller rented GPU never admitted long prompts without a cached prefix. A server flag fixed it; the host made the same flag its default shortly afterwards. |
| An empty patch “resolved” every task in one repository. | The tests imported the installed package instead of the edited workspace copy. Running the official sandbox setup fixed it. |
| An empty task list reported a successful run. | A 0-of-0 run counted as complete. |
| A resolved flag was treated as proof that each exact required test had run. | Reproduction against the current verifier found prefix/name matching can accept a required node without that exact test. The flag establishes this verifier’s result, not an independent oracle. |
The first controls check a known failure and a known success: the unchanged repository should fail and the reference patch should pass. This catches important setup and grading errors. Before a GPU block, a scripted fake model also exercises the complete route with predetermined responses, producing one resolved and one unresolved task. Those controls are necessary but leave some errors undetected. Required-name matching, for example, needs targeted negative controls that would fail if the exact required test were missing.
A second check holds the captured patch fixed and replays verification in Docker, separating grading behavior from a new agent attempt. Under one v28 local condition, all 137 verified replays agreed with their original subprocess grades; 28 other executed replays remained unverified. These counts describe replay attempts and how fully they were checked, rather than solved tasks. Later v29 follow-up changed that interpretation: of 35 planned changed-patch cases, 34 ran and 28 were verified; among those 28, six attempts across two issues disagreed with the original grade. Protected test/config filtering was consistent with those changes. The follow-up covered selected patches rather than the whole population, so the earlier agreement remains evidence for its recorded v28 condition.
Table 4. Local evaluation setup and controls.
| Part | Present form |
|---|---|
| Hardware | One rented RTX 6000 Ada (48 GB), tensor parallelism 1, serving a mirror of the official wheelhouse. Kaggle’s four L4 GPUs share its compute capability but were too limited in weekly quota for repeated runs. |
| Gates | The scripted-model route check and the per-task controls above, required before every block. |
| Identity | Each result carries the fingerprint described in Section 1. |
| Readings | Each checkpoint is recorded with observations and provisional readings that can be revised. |
Two remaining reproductions illustrate why each diagnosis needs an implementation scope. The current verifier has edge cases in required-test matching. The local subprocess backend also rewrites workspace paths inside some shell string literals. We retain the runtime identity with each reproduction, and do not extend the local path-rewriting observation to the hidden Docker sandbox. These specific failures call for targeted checks; they do not invalidate every recorded grade.
One limitation remains. In the local sandbox the agent runs as the same user as the evaluator, so it could in principle read reference material through the shell. No audited trace shows such a read. A trace is an event log, not a filesystem audit, so recording exposure is not an access-control boundary. Separately, repeated use of public tasks can influence development choices. We therefore keep 25 public tasks outside recorded model runs, and track which other tasks were used for design, analysis, or training. This protects the intended evaluation role; it cannot certify absence from model pretraining or every indirect filesystem read.
7. What a hosted score tells us—and what it does not
The local checks make particular runs easier to interpret, but hosted feedback presents a different problem: we receive an aggregate score without the private task-level outcomes. Before comparing agents, it helps to distinguish three questions: how that score is displayed, how repeated executions may vary, and how a different task split may change the result.
For the display, the observed leaderboard values fit a simple working grid. If $k$ Public tasks are resolved out of 58, truncation to two decimals gives:
\[\mathrm{displayed}(k) = \frac{\lfloor 100k/58 \rfloor}{100}, \qquad k = 0, 1, \ldots, 14.\]This maps 6 solves to 0.10, 9 to 0.15, 11 to 0.18, and 14 to 0.24. The host says about 60 Public tasks. The live competition metadata confirms two-decimal truncation, but does not disclose the exact Public denominator. The 58-task grid is consistent with the snapshot, not a directly observed task roster. Task equivalents below are conditional on that interpretation.
Recorded variation on nominally fixed tasks. The same budget-section variant, E0053 (described in Section 8), scored 0.10 and 0.15 from an identical ZIP. Both observations were assigned to HE-11, the eleventh project-defined host epoch. The files and observed public host fingerprints match. This gives a concrete same-package score difference. Without private per-task outcomes, serving logs, or deployment receipts, its cause remains unresolved; we cannot attribute it to random execution variation alone.
For a model of run-to-run variation, let $\pi_i$ be the solve probability of task $i$ and $K_{\mathrm{solves}}=\sum_iY_i$. In general,
\[\operatorname{Var}(K_{\mathrm{solves}})=\sum_i\pi_i(1-\pi_i)+2\sum_{i<j}\operatorname{Cov}(Y_i,Y_j).\]The covariance term captures effects shared across tasks, such as server conditions or remaining time. It vanishes under independent task outcomes, but that independence is an assumption. The two aggregate observations cannot identify task-level probabilities, covariance, or a stable standard deviation. Their spread therefore cannot calibrate a two-task noise floor.
How variation could obscure an improvement. We can still ask a conditional question: if the variation had a particular size, how reliable would one comparison be? Suppose independent draws of two bundles had equal, known standard deviation $\sigma$, and approximately normal errors. If their expected solve counts differed by $\Delta$, the chance of ordering them correctly would be
\[\Pr(\text{correct order})\approx\Phi\!\left(\frac{\Delta}{\sigma\sqrt{2}}\right).\]Table 5. Probability of ordering two bundles correctly under assumed variability.
| Assumed true difference $\Delta$ | Assumed $\sigma = 1$ | Assumed $\sigma = 1.5$ | Assumed $\sigma = 2$ |
|---|---|---|---|
| 1 task | 0.76 | 0.68 | 0.64 |
| 2 tasks | 0.92 | 0.83 | 0.76 |
| 3 tasks | 0.98 | 0.92 | 0.86 |
Here $\Phi$ is the standard normal cumulative distribution function. The table shows how modest improvements could be obscured under its stated assumptions; our submissions do not estimate the three noise levels. That distinction governs the interpretation: an observed best score, a spread, or a non-significant comparison is insufficient to establish an expected ranking or equivalence.
Public versus Private. Repeated execution on a fixed set and evaluation on a new set are different sources of uncertainty. The Private split contains different tasks. Under a separate hypothetical independent-sampling model, solve rate $p$, Public size 58 and Private size 60 would give
\[\operatorname{SD}(\hat p_{\mathrm{Public}}-\hat p_{\mathrm{Private}}) \approx\sqrt{p(1-p)\left(\frac{1}{58}+\frac{1}{60}\right)}\approx0.072 \quad (p=0.19).\]That calculation concerns differences between task samples, not repeated submissions on one fixed set. The actual split design and task dependence are unknown, so 0.072 is not a forecast or confidence interval for this competition.
8. What a local paired comparison can establish
The limited hosted feedback makes local paired comparisons valuable: both bundles face the same tasks, with recorded seeds and alternating execution order. For a binary comparison, pairs that both solve or both fail make no difference to the bundles’ win–loss balance. The sign test uses only the discordant pairs, where one bundle solves and the other fails. A task run under two seeds is still one task with two attempts. For independent paired binary outcomes, $d$ discordant pairs with $g$ candidate wins give the exact two-sided sign test
\[p=\min\!\left(1,\;2\sum_{j=\max(g,\,d-g)}^{d}\binom{d}{j}2^{-d}\right).\]Two wins and no losses give $p=0.5$; six wins and one loss give $p=0.125$. The latter is not automatically a valid task-level test when wins repeat on the same issue. We report attempt counts below and inspect the task-level changes separately.
The working reference allows 28 tool calls, eight minutes per session, and a 4,096-token thinking budget, with a short budget section in its prompt. Its identical files received 0.15, 0.15, 0.15, 0.17, and 0.18 across several observed epochs, including ambiguous windows. Only one of those is a clean HE-11 reference draw. They are not five same-environment repeats.
Table 6. Changes evaluated against the Budget-Fit reference. Counts are resolved attempts; each row retains its own comparison conditions.
| Change to the reference | Local resolved attempts: reference → candidate | Hosted observation |
|---|---|---|
| Remove the 701-byte budget section | 17/44 → 22/44; 22 tasks, two seeds; 1 baseline-only and 6 candidate-only attempts | 0.10 and 0.15, same candidate ZIP, HE-11 |
| Remove earlier thoughts from history | 17/44 → 17/44; 22 tasks, two seeds | Kernel run timeout; no score |
| Allow 36 tool calls instead of 28 | 17/44 → 14/44; 22 tasks, two seeds | Not submitted |
| Greedy decoding (temperature 0) | 14/44 → 16/44; fresh reference run, 22 tasks, two seeds | Not submitted |
| Use a longer public prompt whose author page displayed a best score of 0.22 | 17/40 → 16/40; 40 external tasks, one seed | Our exact package: 0.17; the author’s selected best is not a matched control |
| Use 12B with the same settings | 17/44 → 11/44; 22 tasks, two seeds | Not submitted |
The table collects decisions made in different comparisons. We report the 40-task row as provisional rather than as a completed confirmatory comparison; earlier rows also used different runtime conditions. We preserve those distinctions because combining the rows into one experiment would give them a common control they did not have. Some stopping or advancement rules were fixed prospectively, whereas the budget-section heuristic was proposed after three blocks were visible. That heuristic can describe a decision, but it cannot supply pre-registered evidence for it.
By the October 17 review, roughly 51 measured pod-hours across seven candidate designs had not selected a replacement. The work included screens, small canaries, and paired comparisons, so this total describes the investment up to that review rather than a common seven-arm significance test or the current cumulative cost.
Does a local gain transfer? The reference’s retained public-panel runs resolve about 36% of attempts. Its original two-seed external comparison resolved 31/80 attempts on 40 tasks from six Pallets repositories, or 38.75%. The clean HE-11 hosted reference observation is 0.18; under the inferred 58-task grid that is 11/58, about 19%.
Those rates have different populations, exposure histories, hardware, and protocols. The host selected private-repository tasks with a strong model as a solvability check; it did not say the tasks were chosen to be hard for that model. Dividing local and hosted rates does not produce a transfer coefficient for the next prompt change.
The budget-section variant illustrates the limit. It resolved 22/44 in one comparison, then 13/44 in a later local run. Both runtime and seeds changed, and the latter had no matching E0052 control. The difference therefore cannot identify the runtime’s causal effect. Its two hosted scores, 0.10 and 0.15, likewise do not establish dominance or equivalence. The defensible conclusion is that this local gain did not establish a reliable hosted gain, and the unchanged reference remains our working choice.
9. The twelve-hour limit couples quality to completion
Section 2 separated successful patch delivery from successful repair within a task. A hosted submission adds an outer condition: the whole generation run must finish within twelve hours to receive a score. That couples every task’s time cost to the usefulness of the final submission.
Part 1 decomposed generation time into shared overhead and per-task preparation and agent time. Let $N_{\mathrm{all}}$ count the generation tasks across both Public and Private, so $T=h+\sum_{i=1}^{N_{\mathrm{all}}}(s_i+a_i)$. Here $s_i$ is task preparation and other counted overhead, $a_i$ is agent time, and $h$ is shared overhead. Exceeding twelve hours produces an error rather than a partially scored submission.
For this planning example, let $S_{\mathrm{Public}}$ be the raw Public solve fraction and define utility $U$ as that fraction when the entire generation run completes, or zero if it fails the time limit. Completion concerns both splits; the quality measure in this example concerns Public tasks only. Zero on a timeout is our planning convention; Kaggle records an error rather than assigning that score. Then
\[\mathbb{E}[U]=\Pr(T\le H)\,\mathbb{E}[S_{\mathrm{Public}}\mid T\le H], \qquad H=720\text{ minutes}.\]As an illustration, assume the total time for each task, $s_i+a_i$, is independent with common mean $\mu$ and standard deviation $\sigma$. A normal approximation gives
\[\Pr(T\le H)\approx\Phi\!\left(\frac{H-h-N_{\mathrm{all}}\mu}{\sigma\sqrt{N_{\mathrm{all}}}}\right).\]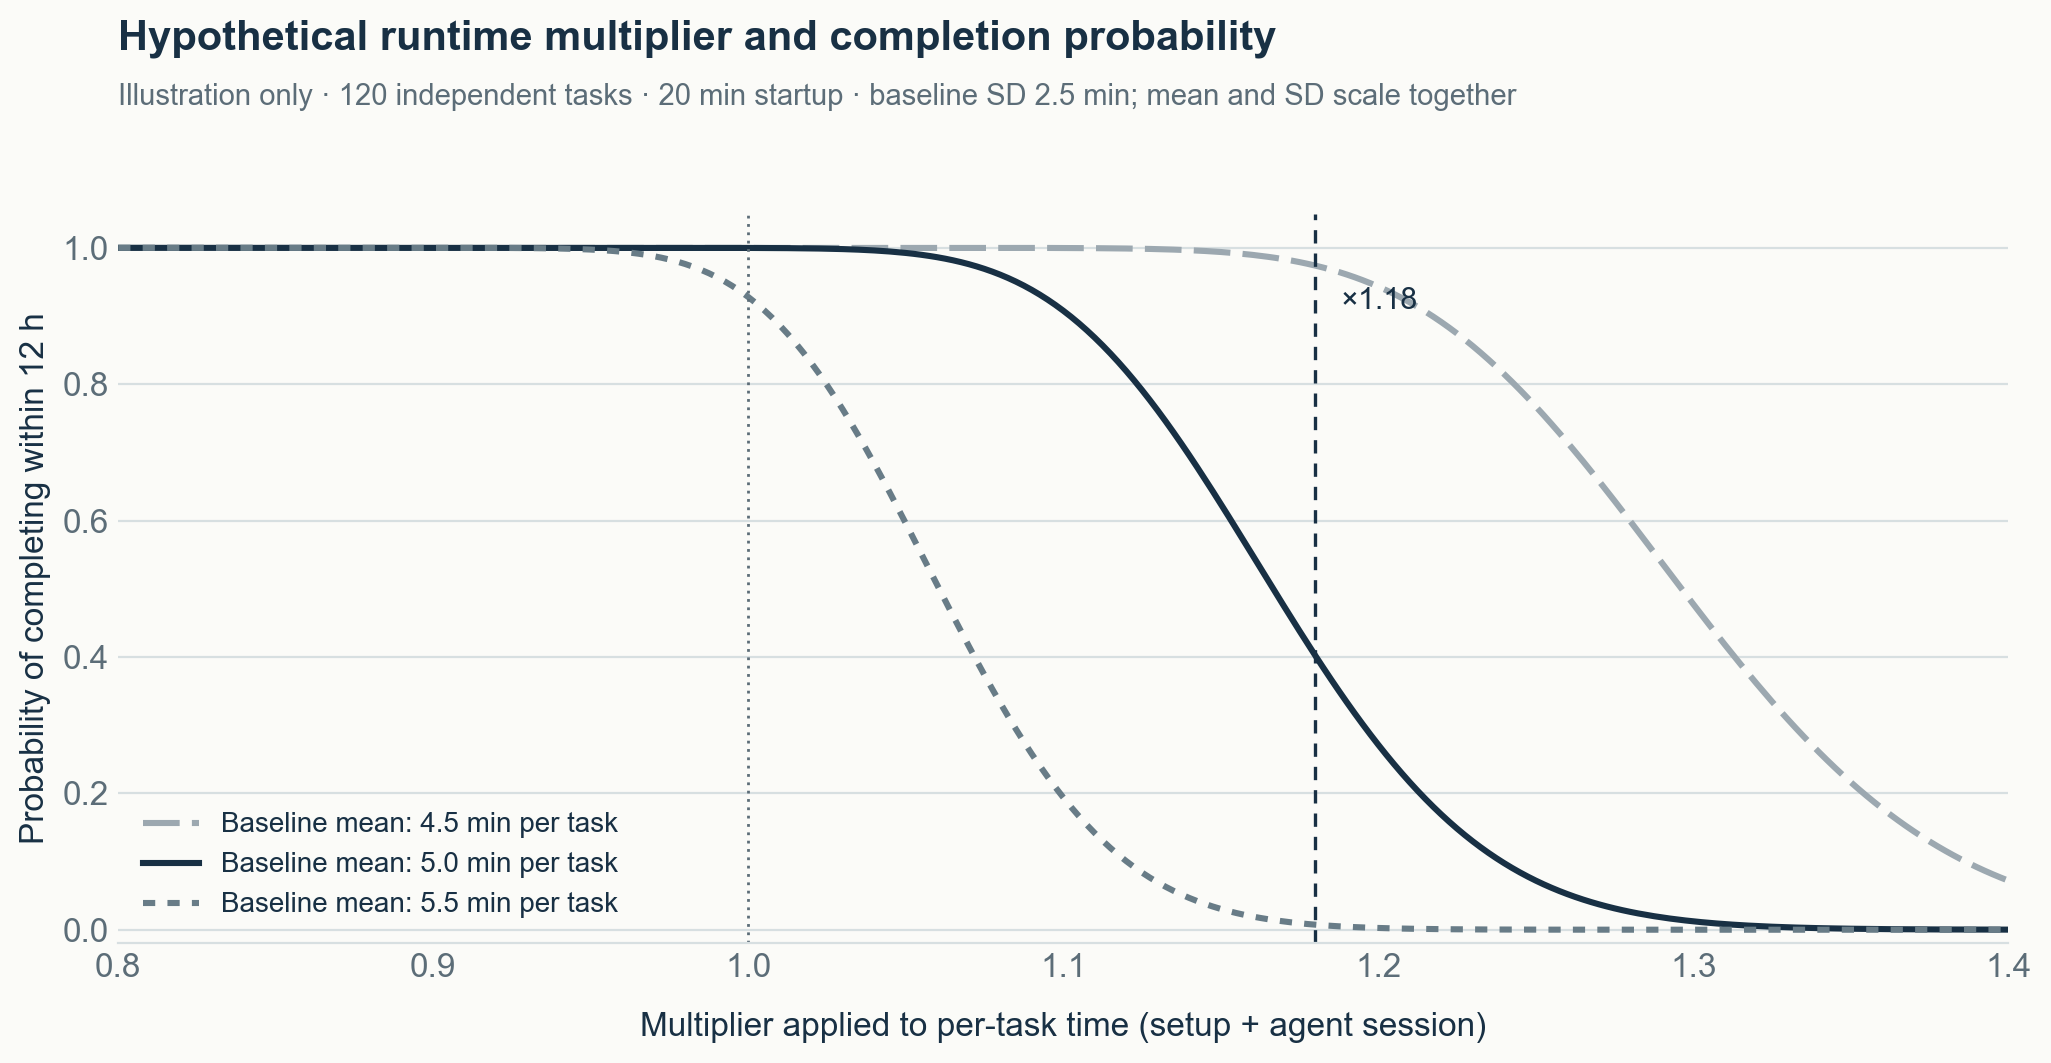 Figure 5. A hypothetical timing model, not hosted measurements: 120 independent task times, reference SD 2.5 minutes, and 20 minutes of shared startup. Multiplying task time scales both its mean and SD. The three curves use reference means of 4.5, 5.0, and 5.5 minutes.
For the 5.0-minute reference, multiplying all task times by 1.18 reduces the illustrative completion probability from essentially one to about 0.40. Suppose the conditional Public solve fraction also improves from 11/58 to 12/58. Using raw fractions throughout, the utility is about $0.40\times(12/58)\approx0.083$, versus $11/58\approx0.190$ for a reference that almost always finishes. To preserve the reference’s expected utility, the improved variant must finish with probability at least $11/12\approx0.917$. Completion has to remain very likely even when conditional repair quality improves.
If task times are correlated, the sum has covariance terms and these curves change. We do not know hosted per-task times or shared overhead, so the figure supplies no safe slowdown threshold.
There is a relevant warning in the records. Removing earlier thoughts tied the reference locally at 17/44 but increased measured agent-session time by about 18%; its hosted run later timed out. This is consistent with a time risk, not proof of its cause. The ratio was measured for agent sessions on one Ada GPU with tensor parallelism 1 (TP1). Hosted execution uses four GPUs (TP4), and its total also includes preparation overhead, so the local ratio cannot be applied to the whole hosted run. In particular, ratios below 1.05 or 1.10 have not been calibrated as safe.
The reference’s eight-minute cap also does not guarantee completion: $120\times8=960$ minutes before setup. Its successful submissions show that the cap need not be reached on every task. They do not disclose how much headroom remained.
10. What the agent’s own checks do not establish
Finishing a run and delivering a patch still leaves the repair question. Reasoning and the newer tool-error handling reduced some early failure modes, yet the remaining errors had several possible explanations. In 140 recorded reference attempts on 40 exposed external tasks, five had an error streak of at least five calls; all five were unresolved. This diagnostic pool combines three groups collected under different recording conditions, including attempts outside accepted final comparisons. It helps locate questions for investigation, with a different evidential role from a fresh evaluation sample.
To investigate the repairs, we distinguish the behavior the agent checks, $C$, from the behavior required by the evaluator’s tests, $R$. An agent can check that its code runs while missing a requirement that determines the grade. A useful local check need not imply every hidden assertion, but it should examine relevant requirements on the actual final code. The question is how much the traces tell us about that connection.
52 of 69 verification-failed attempts touched at least one file also touched by the reference fix, spanning 19 tasks. This is a useful place to look for failed repairs after some source editing. File overlap is a coarse proxy, however: it cannot establish correct localization, and another valid fix might use different files. In 33 of those attempts, a later Python- or pytest-like command had a tool response categorized as non-error. To call these “tests passed but hidden tests failed,” we would still need evidence of a relevant assertion, the actual process exit status, and a check of the final patch. The response category alone supplies none of those, nor the agent’s belief about the result.
A Rich example shows what a direct trace inspection can add. For an issue involving zero-width characters, one agent check established termination while the evaluator checked exact span values for a lone variation selector. The two checks concerned different properties of the output. Existing repository tests provided related format information, but the searched trace did not show those lines being read. That identifies a potential source of evidence the agent missed; whether reading it would have led to a correct repair remains open.
The available specification may also limit what the agent can check. Across four runs on 22 public tasks, statements of at most 120 characters had 7 resolves in 32 attempts; longer statements had 24 in 56. Comparing solve-to-failure odds—$7/25$ and $24/32$, rather than the solve rates—gives the descriptive odds ratio
\[\mathrm{OR}=\frac{7/25}{24/32}\approx0.37.\]Character count is only a proxy for the information available to the agent. The independent units are eight tasks with short statements and fourteen with longer ones, rather than 88 independent tasks; repository and change type also differ. The ratio describes the association; no causal effect or $p$-value is claimed.
These observations made more faithful checking an attractive prompt intervention, but the attempts to deliver it had their own problems. We tried a pinned pre-edit check, fully carried out in only 1 of 8 target opportunities, and an issue-context helper skipped in 7 of 16 attempts. Earlier short command examples were copied more reliably than long procedures in selected traces. This suggests questions about how to present an instruction; it does not yet establish a general advantage for examples or for another compulsory test.
Before adding another instruction, we returned to the traces and asked whether the model had a visible signal that could justify it. A selected eight-case search found no strong model-visible contradiction supporting one minimal corrective instruction. Six cases had details in the evaluator’s tests absent from the statement, although some might still be inferable from repository context. Two weaker ideas remained. This bounded review left the proposed change for checking the issue’s specific scenario parked: the 52-case overlap tally identified a diagnostic population, but did not supply the missing link from an observed failure to an actionable prompt change.
11. Adapters and smaller models: readiness is not a quality result
The prompt reviews left no ready repair intervention, so training and model size need their own evidence rather than serving as automatic next steps. For adapters, the first question is whether the training data and serving path are ready for a quality comparison. The host reported a LoRA fix on September 27, and later said adapters up to rank 64 had scored. This establishes a supported path in that environment. Its capacity and benefit for our package still need measurement; participant reports of additional serving cost and reduced KV capacity are relevant leads.
The data position has changed since the early trajectory inventory. On October 22 we built the training dataset S1 from 65 resolved reference trajectories on 37 public tasks. It contains 1,239 per-call samples, 259,576 target tokens, and 10,938,513 forward tokens. The target tokens are the outputs receiving supervision. Forward tokens also include the prompts and earlier context processed to predict those outputs, so they describe a substantially larger compute workload than the target count alone suggests.
The per-call representation follows how the agent was actually served. When building a later request, the runtime re-renders earlier turns; it does not simply paste every recorded output back verbatim. Concatenating raw outputs into one chain could therefore train on context the model never received. S1 instead preserves the served prompt and output token IDs for each sample, with output-only supervision. Tokenizer decode verification and actual LoRA training on the 31B base model remain outstanding.
Repeated use also determines the evaluation split. The previously exposed training inventory is now assigned to training. The 40-task external panel, X40, and the untouched 25-task holdout are excluded. The six-task loss-development split inside S1 is reserved for loss-based development, separate from measuring repair quality on the untouched holdout.
A hosted completion check added an all-zero rank-16 adapter to the reference. It errored roughly 25 minutes after submission, including queue time. The cause is unknown. A newly checked staff reply acknowledges a concurrent platform incident and promises reruns for submissions affected by it, but no log ties our failure to that incident. Completion, adapter activation, training throughput, and quality are four different questions. No learned-adapter quality comparison has run, and the larger training investment remains parked.
For smaller models, 12B resolved 11/44 attempts against 31B’s 17/44 under the tested reference settings. That is not a universal model ranking. The USD 10,000 E2B/E4B bonus creates a separate opportunity, but an eligible entry must occupy one of the team’s two final selections. On October 23 at 09:01 KST, we submitted an E4B version of the reference, crediting the original package. Its status in the reviewed record is PENDING. A dated small-model standings snapshot had a best Public score of 0.06; our new entry has no score yet and has not earned a final slot.
12. Part 1’s three scenarios, revisited
- The model can do more than its execution procedure permits. Early loops, malformed calls, and context failures support this concern. Bounded reasoning and host fixes helped in particular comparisons; their contributions have not been isolated across the whole history.
- A usable procedure still leaves recurring repair errors. Many failed patches touch reference files, but that does not distinguish incorrect localization, missing requirements, capability limits, or insufficient time. The limited trigger search did not yield a ready intervention.
- Local gains may not transfer. The populations and protocols differ, several observed orderings changed, and same-byte hosted scores varied. These are reasons to qualify a local improvement claim, not a calibrated conversion from local solves to hidden solves.
13. The next decisions
These findings lead to an investment decision. The unchanged reference remains our working choice, while the latest desk reviews left proposed prompt and navigation changes parked or held within their recorded scopes. Further gains remain possible; the next experiment needs a concrete connection between a visible failure, a proposed change, and an outcome that could justify its cost. The current questions are:
Table 7. Current decisions and the evidence needed to revisit them.
| Question | Evidence needed | Current position |
|---|---|---|
| Does E4B warrant further work? | The completion status and score of the pending exact package, read against dated small-model standings | One submitted observation is pending; no superiority or final-slot decision yet |
| Should adapter work resume? | Verified serving behavior, adapter/base-model compatibility, measured throughput and a priced quality comparison | S1 exists; the zero-adapter check errored for an unknown reason; training remains parked |
| Is another repair intervention justified? | A concrete model-visible failure that a small change could address, plus its costs and failure cases | The bounded scenario, stale-check, and navigation reviews did not establish that bridge |
| Can local timing bound submission risk? | Target-topology measurements including setup and the whole task population | Local ratios are warning signals; no universal safe ratio is known |
| Can these records support a research paper? | An exact chronology of observations, exclusions, changed interpretations, and reproducible public material | A narrow case-study scope is being prepared; it is not a validated new agent method |
The optional Paper Track deadline is November 12, 23:59 UTC (November 13, 08:59 KST). The strongest story currently available is a measured case study: how to compare agent changes when the evaluator moves, the local population is repeatedly reused, and hosted feedback is sparse. A convincing account needs to show not just the conclusions we retained, but which attractive conclusions the evidence did not support.
Sources
- Competition overview, evaluation and rules; data and harness guide; official evaluation wheelhouse.
- Host clarifications: sequential scoring and the 12-hour limit; distillation; hidden-set size; other open models’ trajectories; additional model sizes; scoring and task filtering; LoRA submissions; the 12-hour rule stands; small-model bonus; concurrent platform incident.
- Budget-Fit single-agent bundle by Wilmer E. Henao, Apache 2.0, used unchanged as the reference.